
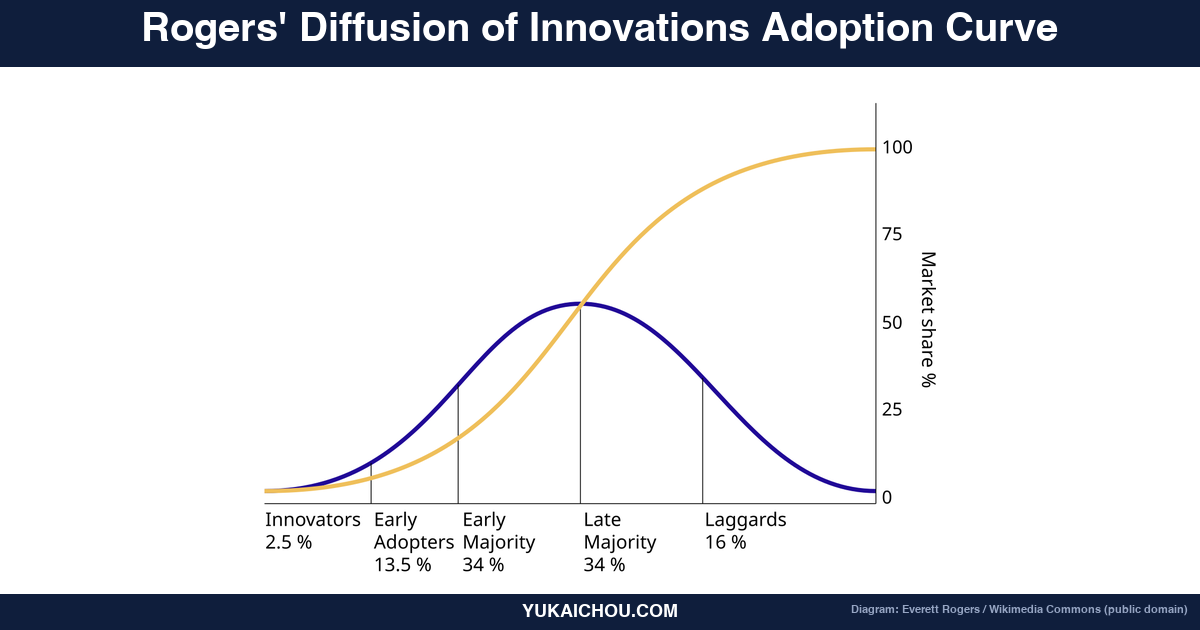

Short answer: Diffusion of Innovations is Everett Rogers’s 1962 model of how a new idea, product, or behavior spreads through a population. Cumulative adoption follows an S-curve, and five attributes of the innovation decide whether that curve takes off.
Those attributes are Relative Advantage, Compatibility, Complexity, Trialability, and Observability.
Rogers split adopters into five segments: Innovators 2.5%, Early Adopters 13.5%, Early Majority 34%, Late Majority 34%, and Laggards 16%. Geoffrey Moore later named the gap between Early Adopters and Early Majority “the chasm.”
Every product, policy, and behavior that ever spread through a population followed roughly the same curve. A small group of restless people picked it up first. Then a slightly larger group with more social standing picked it up. Then it took off. Then it saturated. Then the holdouts came in last, or never came in at all. Everett Rogers named the segments, named the curve, named the attributes that decide whether a new idea moves at all, and gave the entire field of behavior-change a vocabulary it has been borrowing for sixty years.
Most teams reach for Rogers when they are about to launch something and want to look thoughtful. They put the bell curve in a slide, point at Early Adopters, and say “we are targeting this group first.” Then they build for everyone at once anyway. Six months later the launch has stalled at the same place every stalled launch stalls: somewhere between the people who love new things for their own sake and the people who only adopt what their peers already use. Rogers had a name for that gap too. Geoffrey Moore later turned it into a book and an entire consulting practice. It is the place where Diffusion of Innovations stops being a diagram and starts being a design discipline.
This is the version of Diffusion I have used inside Octalysis Framework engagements for the last decade, including with companies whose adoption curve I had to bend by hand: products with strong early-adopter love that never crossed into the mainstream, public-health campaigns that converted innovators and then went silent, B2B platforms that lit up among CTOs and went dark among the line-of-business teams who actually had to use them. In every case the diagnostic was the same. The team had identified the segment correctly. They had not identified the Core Drive that leads at that segment, and so the design move that worked for the prior segment kept getting reused on a segment whose motivation was structurally different.
What follows is the S-Tier Behavioral Designer’s guide to Rogers, the model, the five attributes, the chasm, the honest critiques, the neuroscience underneath, and the per-stage Octalysis design surface that turns the bell curve from a slide into an instrument. Read it once and you will stop pasting Rogers into a deck. You will start building from him.
Speed Run Notes
- Diffusion of Innovations is the S-shaped cumulative-adoption curve over five segments: Innovators 2.5%, Early Adopters 13.5%, Early Majority 34%, Late Majority 34%, Laggards 16%. Rogers, 1962, five editions.
- Whether an innovation diffuses at all is decided by five attributes: Relative Advantage, Compatibility, Complexity (inverted), Trialability, Observability. Compatibility carries the most weight in field studies.
- Take-off happens near 16% cumulative adoption (end of Early Adopters). Saturation begins near 84%. The two inflections are the durable design checkpoints; everything else in the curve is shape.
- The chasm (Moore, 1991) is a Core Drive transition failure: Early Adopters buy on status and vision; Early Majority buys on social proof from people like them, and Early Adopters do not look like them.
- Single biggest field finding the diagram hides: opinion-leader endorsement inside the target segment outperforms mass-media reach by a factor of roughly three to ten across forty years of Rogers’s own meta-analysis.
- Per-stage Octalysis: Innovators lead with Curiosity; Early Adopters with Ownership; Early Majority with Descriptive Social Influence; Late Majority with Loss-Avoidance; Laggards with friction-removal plus sunsets.
In This Article
- Speed Run Notes
- What Is the Diffusion of Innovations?
- The Five Adopter Categories
- The Five Attributes of Innovation
- The Innovation-Decision Process
- The S-Curve and the Chasm
- Where Diffusion of Innovations Falls Apart
- What’s Really Happening Inside the Brain
- Diffusion of Innovations in the Real World
- The Elephant in the Room
- How to Apply Diffusion of Innovations with the Octalysis Framework
About the Creator of the Octalysis Framework

Yu-kai Chou created the Octalysis Framework after studying gamification since 2003, years before the term entered mainstream vocabulary. As a Human-Systems Architect & Behavioral Designer, his framework has been applied by LEGO, Microsoft, Porsche, Coca-Cola, Salesforce, and MrBeast, impacting over 1.5 Billion Users.
Chou has taught the Octalysis methodology at Harvard, Stanford, Yale, Tesla, Google, BCG, and IDEO.
His work has been cited by Harvard, Stanford, MIT, Forbes, Wall Street Journal, Wired, US Department of Energy, NIST, NSF, NCBI, US Department of Education, ClinicalTrials.gov, and Google Scholar — with 3,700+ more academic publications. Explore his books here.

What Is the Diffusion of Innovations?
Diffusion of Innovations is the process by which a new idea, practice, product, or behavior spreads through the members of a social system over time. Everett M. Rogers formalized the model in 1962 with the first edition of Diffusion of Innovations; he revised it across five editions until his death in 2004. The fifth edition is the modern canonical reference, and it synthesizes more than 5,000 diffusion studies across agriculture, public health, telecommunications, education, organizational change, and consumer technology. No other behavioral framework in the twentieth century has been validated across that many fields with that much convergent data.
The model itself is short to state. An innovation moves through a population not all at once but in waves, and the cumulative count of adopters over time traces an S-shape: slow start, sharp middle, slow tail. The population can be sliced into five categories based on how soon a member adopts relative to everyone else, and each category has a recognizable psychological profile. Whether the curve takes off at all depends on five attributes of the innovation itself, judged not by the designer but by the prospective adopter. And the move from no-knowledge to confirmed-use is itself a five-stage decision process that runs inside each adopter’s head, regardless of which category they fall into. Four elements: the curve, the segments, the attributes, the decision process. That is the entire model in one sentence.
What Rogers did that nobody before him had done was synthesize. The bell curve was already in the agricultural extension literature (the Iowa hybrid corn studies of Ryan and Gross, 1943, are the empirical seed for the whole field). The attributes had been observed piecemeal by sociologists studying technology transfer. The opinion-leader concept came from communications research, particularly Lazarsfeld’s 1948 two-step flow of communication. Rogers’s contribution was to put them in one cumulative framework and then test the framework against thousands of cases. The result is the most heavily-cited behavioral-science work of the twentieth century outside of Skinner and Bandura, and probably the most-cited social-science book ever in the management and marketing literatures.
Diffusion is descriptive, not predictive. It does not tell you which idea will spread; it tells you, given an idea that is spreading, what its trajectory will look like and what variables affect that trajectory. This distinction matters because designers regularly try to reverse the arrow. They treat the bell curve as a recipe (“ship to Innovators, then Early Adopters will follow, then the Majority will follow”) when it is actually a description of what happens when the underlying mechanisms align. Get those mechanisms right and the curve appears. Get them wrong and the curve never starts; you adopt the vocabulary without inheriting the outcome.
The Five Adopter Categories
Rogers partitioned the adopter population by standard deviations on a normal distribution of time-to-adopt. The exact percentages (2.5 / 13.5 / 34 / 34 / 16) come from that statistical convention; the conceptual profiles come from his synthesis of the diffusion studies. Treat the numbers as anchors rather than as iron percentages, real adoption distributions are often skewed, but the five categories themselves have held up across six decades of replication.
Innovators (about 2.5%)
Innovators chase novelty for its own sake. They have the cognitive style, the social latitude, and usually the financial slack to absorb a failure. They tolerate ambiguity and incomplete information; they assemble products from documentation rather than from a polished onboarding flow. The same person who installs the public beta of a new operating system on her primary laptop will also be the first in her town to install solar panels, switch to a continuous-glucose monitor without a prescription, or experiment with an unreleased AI coding tool. The pattern is consistent across domains because Innovator-ness is a stable trait, not a topical preference.
From a Core Drive (CD) standpoint, Innovators are powered by Core Drive 7 (CD7): Unpredictability & Curiosity, the dopaminergic pull of the new, and Core Drive 3 (CD3): Empowerment of Creativity & Feedback, the satisfaction of taking raw material and shaping it. They do not need a polished experience because the rough edges are part of the appeal. Designing “polish” for Innovators actively hurts: it strips away the artifact they want to play with. The design move for Innovators is to give them the documentation, the API, the developer mode, and stay out of their way. They do the design work themselves.
Innovators are essential but they are not the audience. They are the dispersal mechanism. Every adoption curve needs them to seed it, but selling to Innovators is a different job than selling to anyone else. Their endorsement does not transfer across the chasm unless the next segment can see itself in them, which it usually cannot.
Early Adopters (about 13.5%)
Early Adopters are the most important segment in Rogers’s entire model, and the segment most teams mistake for Innovators. They are not the same. Early Adopters are opinion leaders in their local social system. They have status to lose, which means they will not adopt anything that looks foolish; they have status to gain, which means they will adopt anything that looks visionary. They study the innovation more carefully than Innovators do because the social consequence of a bad bet is higher. When they commit, others watch.
This is the segment Rogers’s own meta-analyses identified as the single highest-leverage target for diffusion-acceleration campaigns. Opinion-leader endorsement inside a target community, validated across four decades of field studies in agriculture, family planning, water sanitation, and clinical practice change, consistently produces three to ten times the per-dollar effect of mass-media reach. Not because Early Adopters are more numerous (they are not) but because the next segment uses Early Adopters as a reference group rather than the media or the Innovators.
The Core Drive profile is Core Drive 4 (CD4): Ownership & Possession, they want to own the new thing because owning it confers status, plus Core Drive 2 (CD2): Development & Accomplishment, they want the credit for having seen it first. Selling to Early Adopters is selling them a future identity: the version of themselves who picked the winner. The pitch is not about the product’s features; it is about what saying “I was using this before everyone else” will sound like at next year’s industry dinner.
Early Majority (about 34%)
The Early Majority is the first segment whose decision rule is not internal. Innovators decide based on the artifact; Early Adopters decide based on their reading of the future. The Early Majority decides based on what people like them are already doing. They are deliberate, evidence-driven, and risk-averse in the specific sense that they will not be the first in their reference group to adopt. They will not be the last either. They want to land in the middle of a group that is already moving.
This is the segment that breaks most launches. The product won its Early Adopters. The team assumes the Early Majority is mechanically next. But the Early Majority does not see itself in Early Adopters and is not persuaded by their advocacy. The Early Majority is persuaded by case studies, peer testimonials, integrations into the systems they already use, and the absence of risk signals from the boring sources they trust, IT, procurement, regulatory bodies, their own boss. Selling to Early Majority is selling to a committee that will not say yes until consensus emerges, and consensus emerges from the slow accumulation of low-stakes positive signals.
The dominant Core Drive is Core Drive 5 (CD5): Social Influence & Relatedness, specifically the descriptive-norm half (“people like me are doing this”) rather than the injunctive-norm half (“an authority says I should”). The design move is to make adoption inside the target community visible at scale: usage maps, peer logos, customer-success stories from companies that look exactly like the prospect’s company, not from the lighthouse Innovators. Early Adopters love to be featured. Early Majority adopts when the feature is somebody who looks like them.
Late Majority (about 34%)
The Late Majority adopts under economic or social pressure. They are skeptical by disposition; they wait until adoption is the safer choice than non-adoption. The shift in their personal calculation usually happens when their immediate peers are already in and they are starting to look like the holdout. Or when the cost of not adopting becomes concrete: their bank stops supporting the old version, the tool their team standardized on no longer exports a format they can read, the social cost of being the only one without a smartphone outweighs the cognitive cost of learning one.
Late Majority adopters are routinely treated by product teams as Early Majority adopters with longer sales cycles. They are not. Their decision rule is different. Early Majority asks “is this what people like me do?” Late Majority asks “what am I going to lose if I don’t do this?” The first is approach-motivated; the second is avoidance-motivated. They look similar on the cumulative curve and they are completely different on the design surface.
The Core Drives that lead at Late Majority are Core Drive 8 (CD8): Loss & Avoidance, the fear of falling behind, of being the only one left, of being deprecated, paired with Core Drive 5 (CD5) in its injunctive mode (“the company / the agency / the doctor expects you to do this”). The design move is to make the cost of not-adopting visible without becoming hostile: timed sunsets on the legacy option, regulatory disclosures, manager-level integrations, official-channel endorsements. Aggressive loss framing burns trust, but quiet loss framing closes most Late Majority decisions.
Laggards (about 16%)
Laggards are the last to adopt and a non-trivial fraction never do. They are often older, often more constrained financially and cognitively, and almost always more rooted in tradition or in the specific value-set the innovation displaces. The standard product-team posture toward Laggards is dismissal: they are not the addressable market; abandon them. That posture is usually wrong in three different ways.
First, the population pool inside Laggards is large enough, sixteen percent of a market is bigger than Innovators and Early Adopters combined, to matter in any large-scale system (healthcare, energy, public services, banking). Second, the friction Laggards encounter often diagnoses real product flaws that the earlier segments tolerated because they had the slack to. Third, Laggards are rarely irrational; their tradition is often a coherent system of trade-offs the product has not yet earned the right to override. The Amish do not refuse the telephone because they fear technology; they refuse it because they have done the social calculus and decided it would damage the in-person mode of community they value above any individual convenience.
The design move for Laggards is not motivational. It is subtractive plus calibrated deadline pressure: remove the friction that earlier segments tolerated, then create a structural moment when not-adopting becomes operationally infeasible (the old branch closes, the old software loses security updates, the old form is no longer accepted). Core Drive 6 (CD6): Scarcity & Impatience deployed as a sunset deadline, paired with friction-removal investment, will move Laggards who genuinely benefit from the new option. Laggards who do not benefit will not move, and that is the correct outcome.
The Five Attributes of Innovation
The five categories tell you who adopts in what order, but they do not tell you whether an innovation will diffuse at all. That question turns on the perceived attributes of the innovation. Rogers identified five, in roughly descending order of explanatory power across his meta-analyses. These are the most under-used part of the model. Teams who quote Rogers almost always quote the bell curve and skip the attributes; the attributes are where the design work happens.
Relative Advantage
The degree to which the innovation is perceived as better than the idea it supersedes. Note the word “perceived.” The question is not whether your product is objectively better. The question is whether the prospective adopter, sitting at her desk and weighing the switch, sees enough advantage over the thing she already does to justify the cost of switching. Relative advantage is the single best predictor of adoption rate across the literature, and it is the easiest one for teams to lie to themselves about. Every team thinks their product has obvious relative advantage. Most products have relative advantage that is real but not obvious, which is a different problem with a different design fix.
Compatibility
The degree to which the innovation is consistent with existing values, past experiences, and present needs of potential adopters. Compatibility is the attribute that field studies consistently rank as the most decisive in real-world adoption, even slightly above relative advantage in many contexts. An innovation that requires the adopter to also change values or workflows will diffuse slowly; one that maps cleanly onto existing patterns will diffuse quickly even when its advantage is modest. The microwave oven diffused fast (compatible with the existing pattern of “heat food in a box”). The metric system diffused slowly in the United States despite being unambiguously better, because it was incompatible with the entire downstream measurement infrastructure.
Complexity
The degree to which the innovation is perceived as difficult to understand and use. Inversely related to adoption: simpler diffuses faster. This is the attribute most amenable to direct design intervention, and the one product teams ship most under-baked. Every additional concept the prospective adopter has to learn before extracting value is friction; every additional concept the prospective adopter has to learn before describing the product to a peer is doubled friction, because it slows word-of-mouth, the engine the model runs on.
Trialability
The degree to which the innovation can be experimented with on a limited basis. Innovations that can be tried without full commitment diffuse faster. The free tier, the in-store demo, the seven-day trial, the pilot district, the test farm. Trialability is the attribute that “freemium” and “limited beta” categories were invented to optimize. It works because trial reduces the perceived risk of adoption to roughly the cost of one’s own time, which is a level of risk Early Adopters and Early Majority are both willing to absorb.
Observability
The degree to which the results of the innovation are visible to others. Visible adoption breeds further adoption; invisible adoption stays bottled inside individual heads. The Tesla Model S diffused faster than equivalently-spec’d competitors in part because it was obviously a Tesla on the road. A new web framework adopted by a CTO is invisible to her peers; a new web framework that ships a recognizable logo as a footer on the live site is observable. Observability is the attribute most directly under the control of branding and product design, and it is the one that converts adoption into further adoption through Core Drive 5 (CD5) without any additional spend.
The five attributes are roughly the questions a prospective adopter is unconsciously asking. Is it actually better? Does it fit my life? Is it easy enough? Can I try it without committing? Will anyone see me using it? An innovation that answers all five with a confident yes diffuses fast. An innovation that answers two of them with a yes and three with a maybe will stall in the Early Adopter tail and never cross. The audit move is to score your innovation on all five from the prospective adopter’s point of view, not yours, and then design specifically against whichever attribute scored lowest.
The Innovation-Decision Process
Rogers’s third and most under-used contribution is the model of what happens inside a single adopter’s head from first exposure to confirmed use. The Innovation-Decision Process is five sequential stages: Knowledge, Persuasion, Decision, Implementation, Confirmation. Every adopter regardless of category runs this loop. Designers who only think at the segment level miss that the bottleneck is usually at a specific stage, and the stage that bottlenecks varies by population.
Knowledge is the moment the adopter first becomes aware the innovation exists. Mass media is good at this stage and bad at all the others. Most marketing budgets are spent here even when the bottleneck is downstream.
Persuasion is the formation of a favorable or unfavorable attitude toward the innovation. This is where the five attributes from the previous section do their work. Persuasion is heavily influenced by interpersonal channels, especially opinion leaders inside the adopter’s reference group. If the audience knows about your product but is not adopting, the bottleneck is at Persuasion, and mass-media spend will not fix it. Reference-group endorsement will.
Decision is the explicit commitment to adopt or reject. This stage benefits more from trialability than any other. A free trial converts the decision from “commit to this innovation” to “commit to seven days of exploring this innovation,” which is a substantially lower-risk decision the prospect’s brain handles differently.
Implementation is the period of putting the innovation to use, where actual problems surface. Most product teams under-invest in implementation support because by then the prospect has “converted” on the funnel dashboard and looks like a won deal. In reality, implementation is where most innovations get quietly abandoned in the first ninety days. The single highest-leverage diffusion investment most B2B teams could make is moving half their marketing budget into onboarding success engineering and discovering that retention climbs faster than acquisition could have ever delivered.
Confirmation is the post-implementation stage where the adopter seeks reinforcement of the decision already made. Confirmation is where word-of-mouth advocacy is generated or suppressed. Adopters whose Confirmation stage goes well become opinion leaders for the next wave; adopters whose Confirmation stage goes poorly become anti-advocates whose negative word-of-mouth poisons the well for the entire reference group. The post-purchase phase is, in diffusion terms, the most important marketing phase, and almost no company budgets it as such.
The S-Curve and the Chasm
Plot the cumulative number of adopters against time and you get an S. Slow start, rapid middle, slow tail. The shape is mathematically the same regardless of the field because the underlying generative mechanism is the same: each new adopter increases the number of social contacts who can see the innovation in use (the observability attribute), which increases the next adoption rate, which compounds, until the addressable population thins and the rate slows again. Frank Bass formalized this in 1969 as the Bass Diffusion Model, separating innovation coefficient p (external influence, advertising, mass media) from imitation coefficient q (internal influence, word of mouth). For most categories, q dominates p by an order of magnitude; the S-curve is, fundamentally, social.
Two inflection points on the S-curve are the durable design checkpoints. The first is the take-off, which sits near sixteen percent cumulative adoption (the end of Early Adopters). Before take-off, the curve is fragile; growth depends on continued external push. After take-off, the curve has its own internal momentum and external push can be reduced. Many launch campaigns end exactly when they should start tapering, then cut spend right as the curve was about to self-sustain. The second is the saturation point, near 84% cumulative adoption (the end of Late Majority). After saturation, marginal acquisition cost rises sharply because the remaining adopters are by definition the hardest to convert. Continuing to spend acquisition dollars at saturation rather than pivoting to retention and category expansion is the most common cause of late-stage growth drag.
Between Early Adopters and Early Majority sits the model’s most famous failure mode: the chasm Geoffrey Moore named in Crossing the Chasm (1991). Rogers had identified the gap qualitatively; Moore made it commercially actionable in tech-marketing. The chasm exists because the two segments’ decision rules are structurally different. Early Adopters buy on vision and status. Early Majority buys on pragmatic reference. Early Adopters do not look like Early Majority. So Early Adopters’ advocacy fails to land with Early Majority, exactly the mechanism Rogers identified as the dominant driver of diffusion the rest of the time. The endorsement engine breaks at the boundary between segments because the reference-group mapping breaks.
Moore’s prescription, which has survived three decades of practical use in B2B markets: pick one narrowly-defined Early Majority segment, build a beachhead inside it with a few lighthouse customers who are themselves Early Majority companies, and use them as the reference-class signal for the rest of that segment. The chasm closes not by louder Early Adopter advocacy but by shifting the source of social proof to inside the Early Majority’s own reference group. The same logic applies outside B2B: in public health, in education, in policy. The chasm is a Core Drive transition problem, not a marketing-spend problem.
What Rogers Got Right
Rogers’s lasting contribution is the recognition that diffusion is fundamentally a social process, not a technical one. The innovation itself is necessary but not sufficient; the social structure of the adopting population is the actual diffusion medium. This is now obvious in hindsight but it was not obvious in 1962, when the dominant view of innovation in business was the “better mousetrap” theory (build something good and the world will beat a path to your door). Rogers’s data showed unambiguously that the world does no such thing. Hundreds of objectively superior innovations failed to diffuse because the social channels for endorsement were absent or pointed the wrong way; hundreds of mediocre innovations diffused widely because they happened to map cleanly onto an existing channel.
The second thing Rogers got right is the irreducible role of opinion leaders inside reference groups. The mechanism the data keeps surfacing is not mass communication to individuals; it is two-step communication through opinion leaders who interpret and contextualize the innovation for their group. Lazarsfeld had observed this in voting behavior; Rogers generalized it across every domain he studied. Six decades later the influencer marketing industry is essentially an applied (and often distorted) version of opinion-leader theory. The original insight is more disciplined than what the industry made of it: an opinion leader is not someone with a large audience; an opinion leader is someone whose endorsement specifically lands inside a target segment’s reference group. The two are sometimes the same person and very often not.
The third durable contribution is the attribute framework itself. Most behavioral models of adoption are silent on what makes an innovation adoptable in the first place. Rogers gave us five testable, measurable attributes and showed that the rank-order of explanatory power is roughly stable across domains. That is rare in social science and it is the part of the model that has held up most cleanly under replication.
Where Diffusion of Innovations Falls Apart
The model has held up across sixty years of replication, but it has three honest failure modes worth naming. Most teams either pretend these do not exist or treat them as fatal. Both responses are wrong. The discipline is to use the model where it works and reach for a complementary theory where it does not.
It is descriptive, not prescriptive
The S-curve describes what happens when an innovation diffuses; it does not tell you how to make it diffuse. This is the most under-acknowledged limit of the model and the source of most misuse. Teams put the bell curve in a slide and act as if drawing the curve creates the curve. It does not. The curve appears when the underlying mechanisms, opinion-leader endorsement, attribute fit, observability in the adopter’s reference group, align. Pair Diffusion with a behavior-change theory like Theory of Planned Behavior or the COM-B model at the individual decision level, and pair it with a network-science model (Bass, Watts-Strogatz small-world, Centola complex-contagion) at the population level, or it stays descriptive forever.
Pro-innovation bias is baked into the original work
Rogers himself acknowledged this in later editions. The model implicitly treats adoption as the desirable outcome and non-adoption as a failure to be explained. But many innovations should not diffuse, they are net-harmful, premature, or incompatible with values the adopter is correctly preserving. The Laggard category in particular is often pathologized when it should be respected. The Amish are not Laggards on the telephone; they are doing a coherent welfare calculation about community structure. Pro-innovation bias becomes operationally dangerous when diffusion theory is recruited to push adoption of things like predatory financial products, surveillance technology, or extractive platforms onto populations that would be better off resisting. Treat the model as morally neutral and add an explicit ethics layer at the population level. Diffusion does not adjudicate whether the innovation should spread; that is your job.
It is light on individual-level psychology
Rogers operates mostly at the population and reference-group level. The Innovation-Decision Process is the model’s individual-level component and it is the weakest part of the framework. The five stages are real but they are shallow; they do not specify the cognitive or motivational mechanisms by which a specific person moves from Persuasion to Decision. The classical behavioral-economics literature on choice under uncertainty (Kahneman-Tversky), the health-behavior frameworks (Health Belief Model, Theory of Planned Behavior), and Self-Determination Theory all do substantially more work at the individual level than Rogers does. Use Diffusion to model the population dynamics and use one of those frameworks to model the individual within it. They are complements, not substitutes.
What’s Really Happening Inside the Brain
Diffusion is at root a story about social cognition, and the last twenty years of social-neuroscience research has filled in mechanisms Rogers could only describe at the behavioral level. Three findings are worth naming because they sharpen the design implications.
The first is that observing a peer’s reward activates the observer’s own ventral striatum, the same dopaminergic system that lights up when the observer experiences a reward directly. This is the neural substrate for vicarious reinforcement, and it is why the Early Majority’s decision rule is “people like me are doing this.” The observation is not a cognitive inference; it is a partial pre-experience of the reward. When Early Majority sees Early Adopters succeed, however, the vicarious activation is muted because the observed agent is too dissimilar, the brain’s mirroring system is calibrated for similarity. This is the chasm at the neural level.
The second is the difference between simple and complex contagion. Damon Centola’s lab has shown experimentally that behaviors with social risk (those where adopting could make you look foolish if it fails) require multiple independent confirmations before an individual will adopt, while behaviors with low social risk can spread on a single exposure. The behavioral-economics literature calls this the threshold effect. The neural mechanism appears to be a Bayesian updating process in the medial prefrontal cortex that requires multiple convergent signals before tipping. This explains why the cumulative-adoption curve has a discontinuous take-off near sixteen percent rather than a smooth ramp: that is roughly the point where the average prospective adopter’s threshold gets crossed by enough independent reference-group signals.
The third is loss-aversion asymmetry, which dominates Late Majority adoption. The brain processes losses roughly 2.25 times as strongly as equivalent gains (Tversky and Kahneman’s original Prospect Theory estimate, replicated dozens of times since). The Late Majority is not slower to adopt because they are slower to evaluate evidence; they are slower because the gain side of the ledger has to clear a much higher bar to overcome the felt cost of switching. Design for Late Majority is not about adding more benefits; it is about reducing the felt loss of leaving the existing option, which is a different design move entirely.
The synthesis: the bell curve and the S-curve are emergent behaviors of a population whose individual brains are running roughly the same algorithms with different parameter settings. Innovators have unusually low novelty-aversion. Early Adopters weight status-gain more heavily. Early Majority requires more peer-confirmation signals before its threshold tips. Late Majority is dominated by loss-aversion. Laggards have the highest switching costs because their existing routines have been reinforced for the longest. The shape of the population curve is the shape of the threshold distribution. That is the neuroscience hiding inside the diagram.
Diffusion of Innovations vs Other Theories
Diffusion sits in a crowded neighborhood of frameworks that overlap with it at different points. Naming the overlaps and the differences sharpens when to reach for which.
vs the Bass Diffusion Model (Frank Bass, 1969)
The Bass model is the mathematical formalization of the S-curve. It models cumulative adoption as a function of two coefficients: p (innovation, external influence) and q (imitation, internal influence). It predicts when a new product will reach peak sales and when sales will plateau. Bass is to Rogers what Newtonian mechanics is to Galileo’s qualitative observations of motion: the same phenomenon at a different level of formality. Use Bass when you need quantitative forecasts (peak sales month, expected market penetration at year three). Use Rogers when you need design implications (which segment to target, which Core Drive leads at that segment, which attribute needs fixing).
vs Crossing the Chasm (Moore, 1991)
Moore took Rogers’s qualitative observation of the discontinuity between Early Adopters and Early Majority and built an entire commercial methodology around it: the technology adoption life cycle, the bowling-alley strategy, the tornado, Main Street. Moore is, in effect, Rogers applied specifically to discontinuous innovations in B2B technology markets. The bowling-alley strategy (pick one Early Majority beachhead segment, build dominant share there, then knock down adjacent segments) is the operational expansion of Rogers’s observation that diffusion proceeds through reference-group networks. Use Moore for B2B go-to-market strategy. Use Rogers for the broader theory and for any non-tech, non-B2B context where Moore’s specifics do not apply.
vs the Theory of Planned Behavior (Ajzen, 1991)
TPB models the individual’s intention to perform a behavior as a function of attitude, subjective norm, and perceived behavioral control. Where Rogers operates at the population and reference-group level, TPB operates inside the head of a single decision-maker at a single decision point. The two are complementary: Diffusion tells you the population dynamics over time; TPB tells you why a specific person decided yes or no in a specific moment. The cleanest synthesis is to use TPB at the Persuasion-and-Decision stages of Rogers’s Innovation-Decision Process. Subjective norm in TPB is Rogers’s reference-group endorsement at the individual scale; perceived behavioral control is the Complexity attribute filtered through the individual’s self-efficacy.
vs COM-B (Michie, van Stralen, West, 2011)
COM-B identifies three necessary conditions for behavior: Capability, Opportunity, Motivation. It is a behavior-change framework rather than a diffusion framework, but it is more recent than Rogers and more disciplined at the individual level. The cleanest use: COM-B audits the bottleneck at the individual-adoption level (does the prospective adopter have the Capability to use the innovation? the Opportunity? the Motivation?), and Diffusion handles the population-level dynamics of how those individual adoptions aggregate into the S-curve. If your Diffusion curve has stalled, run a COM-B audit on a representative sample of the target segment; the bottleneck is almost always at exactly one of the three letters, and the design fix follows directly from which one.
vs Complex Contagion (Centola, 2018)
Centola’s complex-contagion research is the most important update to Rogers in the network-science era. Simple contagion (like a virus, or a piece of trivia) spreads on a single exposure. Complex contagion (like a behavior with social risk) requires multiple independent reinforcing exposures from sources the adopter trusts. Most of the behaviors Rogers studied are complex contagions. Centola’s contribution is showing experimentally that the network topology that maximizes simple-contagion spread (long-range weak ties, the small-world architecture Granovetter described) is the opposite of the topology that maximizes complex-contagion spread (densely-clustered local neighborhoods with overlap, which produce the multiple-reinforcement exposures complex behaviors require). The design implication is large: viral-marketing playbooks built for simple-contagion content fail when applied to behaviors that are actually complex contagions, which is most of the behaviors anyone wants to spread.
Diffusion of Innovations in the Real World
The model has been validated across so many fields that the harder editorial task is choosing a small enough set of examples to illustrate without becoming a catalog. The four below cover the four most common contexts where Diffusion design work actually happens, with the per-stage Core Drive shifts visible in each.
B2B SaaS adoption
The B2B SaaS market is where Moore’s bowling-alley strategy was born and where Diffusion gets the most disciplined operational use. A typical SaaS launch wins its Innovators (engineering early-adopters who install the tool for personal projects), then wins a wave of Early Adopters (CTOs and head-of-engineering buyers who want to be seen as forward-thinking), then stalls. The chasm shows up as a quarterly revenue plateau where the easy mid-market deals are won but the larger Early Majority enterprises will not commit. The fix is rarely a feature; it is almost always a reference-class shift. Build two or three lighthouse case studies in companies that exactly match the Early Majority target’s profile (size, industry, regulatory posture, stack), then let those case studies do the social-proof work that Early Adopter testimonials cannot. Stripe’s enterprise expansion, Notion’s shift from creator-tool to enterprise wiki, and Slack’s enterprise grid pattern all followed this template. The Core Drive shift from Early Adopter (CD4 status) to Early Majority (CD5 descriptive norm) is the design move; the case studies are the surface that move sits on.
Public-health campaigns
Tobacco-control programs are the most-studied multi-decade diffusion success in public health. US adult smoking dropped from 42 percent in 1965 to about 11.5 percent in 2021. The campaign that produced that drop was explicitly multi-stage: it converted Innovators and Early Adopters through education on health risks (CD8 loss-aversion framing at the individual level), then crossed the chasm through reference-group denormalization (smoking moved from a high-status to a low-status behavior in middle-class peer groups, the CD5 descriptive-norm shift), then pulled Late Majority through policy and price (excise-tax increases, indoor smoking bans, plain packaging, CD8 plus structural friction). Vaccine campaigns follow a similar but compressed pattern. The COVID-19 vaccine rollout in 2021 hit the take-off near sixteen percent and saturated near eighty percent within six months in most US states; the remaining holdouts pattern-match Laggards plus a smaller actively-resistant subgroup. Public health that recognizes the segment-by-segment Core Drive shift outperforms public health that runs the same message to everyone.
Consumer technology and the smartphone era
The smartphone is the cleanest large-scale recent Diffusion example. The iPhone in 2007 converted Innovators (developers and gadget enthusiasts who could tolerate the original’s lack of apps, no copy-paste, AT&T-only). The iPhone 3G in 2008 with the App Store opened Early Adopters (status-conscious knowledge workers who wanted to be seen with the new thing). Android’s growth from 2010 onward and the iPhone 4 redesign converted Early Majority through reference-group spread (your sibling, your colleague, your boss got one). Late Majority adoption was largely driven by carrier-subsidized upgrade cycles and the operational deprecation of feature phones, the loss-aversion side. Laggards were dragged in by the disappearance of payphones, the migration of bank logins to two-factor authentication, and the gradual collapse of feature-phone retail availability. Each segment’s adoption was driven by a different Core Drive even though the underlying device was the same.
Digital platforms and the network-effect amplifier
Platforms with strong network effects (Slack inside companies, WhatsApp inside countries, TikTok inside cultural cohorts) follow the standard S-curve but with a sharper take-off and a faster saturation because each new adopter increases the value of the platform for everyone else. The observability attribute is supercharged: the visible peer network is itself the product. Slack’s enterprise diffusion within a company often takes seven to fourteen days from first install in one team to organization-wide rollout, because the chasm is short (the reference group is bounded to the company) and the observability is total (every meeting that mentions Slack creates a knowledge exposure). The same model running across companies takes years rather than weeks because the reference group is now an entire industry rather than a department. The S-curve is recursive: each level of the social system has its own curve, and the timescales differ by the size of the reference group.
The Elephant in the Room
Most teams who quote Rogers in a deck are using him as decoration. They put the bell curve in slide seven, point at Early Adopters, claim “we are targeting them first,” and proceed to build for everyone simultaneously. The diagram is invoked as vocabulary while the actual go-to-market plan ignores everything the diagram is supposed to teach. This is the model’s most common operational failure mode and it is worth naming directly because almost everyone in the field does it at least sometimes.
The honest tell is whether the team can name, in operational detail, what the design move specifically for Early Adopters looks like and how it differs from the design move specifically for Early Majority. If the team cannot name a difference, they are not actually using the model. They are using it as a credential, “we know about Rogers, therefore our launch plan is sophisticated.” The model is a design surface, not a credential. If the only place the model shows up is in the deck, it is doing none of the work the model is supposed to do.
A second elephant: the field has accumulated an enormous body of evidence on what works at each diffusion stage, and most product teams are operationally illiterate about that evidence. The single largest piece of operational knowledge is that opinion-leader endorsement inside the target reference group is, in Rogers’s own meta-analysis of forty years of field studies, three to ten times more effective per dollar than mass-media exposure. Almost no product team allocates spend in those proportions. The default is the inverse: 80 percent of budget goes to mass-media reach, 20 percent or less to opinion-leader cultivation. The default is wrong, the data has been clear about this since the 1980s, and the inertia is purely organizational. The agency-and-budget structure of marketing departments is built for mass-media buys, not for the patient relationship work that opinion-leader cultivation requires.
A third elephant: the model’s discomfort with non-adoption. Rogers’s framing assumes adoption is the goal and explains non-adoption as a failure to overcome resistance. But there are many innovations a target population should resist, and the model has historically been recruited to push adoption of things the adopter is correctly skeptical of. Diffusion theory has been used to spread predatory financial products into low-income communities, to push pharmaceutical adoption faster than safety data justified, to accelerate the rollout of surveillance technology into communities with no negotiating leverage. The model is morally neutral. The designer using the model is not. Naming this directly is part of the discipline.
How to Apply Diffusion of Innovations with the Octalysis Framework
The Diffusion model tells you the order in which different psychological types adopt. The Octalysis Framework tells you which of the eight Core Drives leads at each type. Without the second layer, Diffusion is a vocabulary; without the first layer, Octalysis is applied generically to a heterogeneous audience whose segments require structurally different design moves. The synthesis is the part of the framework that does the actual work.

The discipline below is the per-segment Core Drive assignment I have used inside Octalysis Framework engagements for the last decade. Each segment leads with one or two Core Drives that match its decision rule, with a different pair of Core Drives that should be deliberately suppressed because deploying them at the wrong segment burns the trust the next segment needs. Spreading all eight Core Drives evenly across all five segments is the dominant failure mode and it produces a design that does no segment’s job well.
Innovators: Core Drives 7 and 3
Innovators are activated by Core Drive 7 (CD7): Unpredictability & Curiosity, the dopaminergic pull of the new, and Core Drive 3 (CD3): Empowerment of Creativity & Feedback, the satisfaction of taking raw material and making something with it. The design move is to ship a developer mode, an API, an open beta, raw documentation, and explicit invitations to break the product and report back. Do not ship polish. Polish actively repels Innovators because it strips out the rough edges they wanted to play with. The product’s job at this stage is to be configurable, not complete. The Game Technique surface includes Discovery #21, Mystery Boxes #72, Easter Eggs #30 (CD7); plus Open Sandbox / Crafting #59 and Configurable Avatar #4 (CD3). Suppress CD5 social-proof framing here, Innovators are anti-bandwagon by disposition and visible peer adoption registers to them as a signal the thing is past its peak.
Early Adopters: Core Drives 4 and 2
Early Adopters are activated by Core Drive 4 (CD4): Ownership & Possession, the status of being seen with the new thing, and Core Drive 2 (CD2): Development & Accomplishment, the credit for having picked the winner. The design move is to make Early Adopter status visible: founding-member badges, public early-customer logos, “first 100 customers” lists, beta-tester credit lines, conference shout-outs. Pair this with a clear progression ladder so the Early Adopter can show they have advanced beyond casual use into expert use; the public-progression part of CD2 is what converts the badge into a durable identity. The Game Technique surface includes Early Adopter Badges (CD4 status), Status Levels #6, Aura Effect #38 (CD2 expertise visible to others); plus public Leaderboards #3 ranked by Early Adopter cohort. Suppress CD8 loss-aversion framing here, Early Adopters are explicitly approach-motivated; fear framing makes the product look defensive and signals the team is desperate, which corrodes the visionary positioning Early Adopters bought into.
Early Majority: Core Drive 5 (descriptive)
Early Majority is activated by Core Drive 5 (CD5): Social Influence & Relatedness, specifically the descriptive-norm half (“people like me are doing this”) rather than the injunctive-norm half (“an authority recommends it”). This is where the chasm closes or does not close. The design move is to make adoption inside the Early Majority’s own reference group visible at scale, and to make sure the visible adopters look like the prospect rather than like the Early Adopters. Customer logos sorted by industry-and-size that matches the prospect. Case studies that read like the prospect’s own situation. Peer-to-peer events where Early Majority customers tell their story to other Early Majority prospects without the vendor in the room. Usage maps that show density inside the target sector. The Game Technique surface includes Friend Boast #80, Social Treasures #63, Group Quests #22 (CD5 descriptive); Customer-logo Walls; in-product peer-discovery features. Suppress CD7 novelty framing here, Early Majority interprets visible novelty as instability, which raises perceived risk and stalls the deal.
Late Majority: Core Drive 8 + Core Drive 5 (injunctive)
Late Majority is activated by Core Drive 8 (CD8): Loss & Avoidance, the fear of falling behind, of being deprecated, of being the only holdout, paired with Core Drive 5 (CD5) in its injunctive mode (“the standard-setting body / the regulator / the manager expects this”). The design move is to make the cost of not-adopting visible without becoming aggressive: planned sunsets on the legacy option with long advance notice, regulatory or standards-body endorsements, official-channel integrations, manager-level mandates inside enterprises, format-deprecation notices. The framing is informational rather than threatening; the loss is real and the message simply names it. The Game Technique surface includes Countdown Timers #65 on legacy-option deprecation, Status Quo Sloth #76 cleared by manager-led group migrations, Visual Grave #67 for the discontinued option. Suppress CD7 novelty framing, Late Majority is past the point where novelty motivates and into the point where novelty signals risk, and suppress aggressive CD8 framing, fear messaging burns trust faster at Late Majority than at any other segment.
Laggards: subtractive design + Core Drive 6 sunsets
Laggards do not respond to any additive design move. The strategy is subtractive: remove the friction that earlier segments tolerated because they had the slack to, and create structural moments when not-adopting becomes operationally infeasible (the old branch closes, the old form is no longer accepted, the legacy software loses security updates). Core Drive 6 (CD6): Scarcity & Impatience deployed as a planned sunset deadline with substantial advance warning, paired with explicit investment in onboarding support for the segment, will move Laggards who genuinely benefit from the new option. Laggards who do not benefit will resist successfully, and the design correctly leaves them in the old option. The Game Technique surface is sparse here by design: Magnetic Caps #66 on the legacy option, Cosmic Hour #65 deadline framing, white-glove onboarding for the highest-friction holdouts. Suppress every other Core Drive at this segment; over-design at Laggards converts the holdout from passive to actively-hostile.
The Diffusion x Octalysis Audit (six steps)
The audit below turns Diffusion from a vocabulary into a design instrument. Each step has an operational artifact at the end, a written deliverable the team can disagree about. Without that, the audit is decoration.
Step 1: Identify which adopter segment is the current bottleneck. Plot your actual cumulative adoption curve against the canonical S-shape. The segment whose acquisition rate is below the model’s expectation is the bottleneck. Common bottlenecks: stalled at Innovators (the product is too polished, strip the polish back), stalled at the chasm (the case studies feature Early Adopters who do not look like Early Majority, rebuild the reference class), stalled at Late Majority (the loss framing is missing, add the sunset).
Step 2: Name the Core Drive that should lead at that segment. Use the segment-by-segment assignment above. Be honest about which Core Drives are currently leading in your design and which the segment’s decision rule actually requires. The gap between “what we are doing” and “what the segment needs” is the diagnostic.
Step 3: Audit which Core Drives you are deploying at the wrong segment. Cross-stage Core Drive deployment is the most common design error. CD8 fear framing at Innovators repels them. CD7 novelty framing at Late Majority signals risk. CD5 descriptive social proof at Innovators makes the product look like it has peaked. Each error costs more than the equivalent error inside the right segment because the wrong Core Drive at the wrong segment is not just ineffective; it actively repels the target.
Step 4: Run the five-attribute audit on your innovation. Score Relative Advantage, Compatibility, Complexity, Trialability, Observability from the target segment’s point of view. The lowest-scored attribute is where the design budget should go next; the highest-scored attribute is where the marketing budget should go next. Most teams reverse this, they over-market the strongest attribute (which is already winning) and under-design the weakest (which is the actual bottleneck).
Step 5: Build the reference-class lighthouse. Identify three to five customers or community members inside the target segment whose endorsement would specifically land with the rest of that segment. They are usually not the loudest customers. They are the ones whose situation matches the prospect’s situation closely enough that the prospect can map across. Invest disproportionately in their success. They are the diffusion engine for the entire segment.
Step 6: Pilot the chosen Core Drive shift at the smallest scale that lets you observe the segment’s response. Do not change the whole product. Change one design surface, the landing page, the onboarding flow, the case study mix, and measure the response from the target segment specifically. If the bottleneck shifts to the next segment, the pilot worked and the change can roll out. If the bottleneck stays where it was, the diagnosis was wrong and the audit returns to step 1. The discipline of small pilots is what turns the model from rhetoric into design practice.
Practical Steps: Apply Diffusion of Innovations to Your Next Launch
The summary below is the operational checklist I run with teams in the first week of an Octalysis engagement where Diffusion is the lead framework. The steps are sequential, each takes a few hours of disciplined work, and they convert the framework from a slide into a launch plan.
- Define your innovation in operational terms. What specifically is the behavior you want adopted? Who is the adopter, in granular detail (industry, role, prior tools, regulatory posture, peer reference group)? An innovation defined as “our new platform” is too vague to plan; an innovation defined as “the act of switching from spreadsheet-based forecasting to our forecasting tool, by mid-market FP&A teams at companies between $50M and $500M revenue” is plannable.
- Score the five attributes from the target adopter’s point of view. Not yours. Sit with two or three prospective adopters from the target segment and watch them evaluate. The lowest-scoring attribute is your top design priority for the next quarter.
- Map your current customer base onto the five segments. If your existing customers are mostly Innovators and the bell curve is showing only Innovator-style engagement patterns (high configurability use, low standardization, frequent “wish-list” feature requests), you have not crossed into Early Adopters yet. Plan the Early Adopter design move (status visibility, public progression) before planning the chasm crossing.
- Identify three to five Early Majority lighthouse customers whose situation matches the target Early Majority segment’s situation closely enough that other Early Majority prospects can map across. Invest disproportionately in their success. They are the chasm-crossing engine.
- Build the per-segment design surface explicitly. Different landing pages, different case study mixes, different onboarding paths for different segments. The Early Adopter landing page should sell vision and status. The Early Majority landing page should sell peer evidence and risk mitigation. They are different documents because the audiences are different.
- Plan the chasm crossing as a Core Drive transition, not a feature launch. The chasm closes when Early Majority sees people like them succeeding with the product. Spend that budget on case studies, peer-to-peer events, integrations into the systems Early Majority already trusts. Do not assume more Early Adopter advocacy will close it.
- Stage the Late Majority and Laggard moves for after take-off. Late Majority needs the sunset framing and the official-channel endorsement, not the early-launch enthusiasm. Plan these moves for year two or three, not for the initial launch deck.
Diffusion of Innovations Was the Beginning, Not the End
Rogers’s 1962 synthesis remains the foundational text. Six decades of subsequent work, Bass’s mathematical formalization, Moore’s chasm, the network-science research from Watts and Centola, the social-neuroscience work on peer-reward processing, the behavior-change frameworks from Ajzen and Michie, has built outward from Rogers without replacing him. The model has held up better than almost any other behavioral-science framework of its era because the core observation was right: diffusion is a social process whose dynamics depend on the structure of the adopting population, not on the inherent merit of the innovation alone.
The next sixty years of the field will likely refine the model at the network level (which network topologies maximize which kinds of contagion), at the individual level (how the Innovation-Decision Process maps onto specific neural substrates), and at the ethical level (when diffusion should be slowed or stopped rather than accelerated). The Octalysis integration is one part of that refinement. The Core Drive assignment per segment is the design layer Rogers’s model lacks and the layer that makes the difference between teams who use the diagram as decoration and teams who use it as an instrument.
Build from him. Do not just cite him.
Frequently Asked Questions about the Diffusion of Innovations
What is the Diffusion of Innovations theory in simple terms?
Diffusion of Innovations is the model Everett Rogers introduced in 1962 to explain how a new idea, product, or behavior spreads through a population. The cumulative count of adopters traces an S-shape over time, and the population can be sliced into five segments based on how soon each member adopts: Innovators (2.5%), Early Adopters (13.5%), Early Majority (34%), Late Majority (34%), and Laggards (16%). Five attributes of the innovation itself, Relative Advantage, Compatibility, Complexity, Trialability, Observability, determine whether the curve takes off at all.
Who created the Diffusion of Innovations theory?
Everett M. Rogers, an American communication scholar, formalized the theory in the first edition of Diffusion of Innovations (1962). He revised the book across five editions until his death in 2004; the fifth edition (2003) is the modern canonical reference. Rogers built on earlier work by Ryan and Gross (1943, the Iowa hybrid corn studies), Lazarsfeld’s two-step flow of communication (1948), and several decades of agricultural-extension research.
What are the five adopter categories?
The five categories partition adopters by how quickly they adopt relative to everyone else. Innovators (2.5%) chase novelty and tolerate ambiguity. Early Adopters (13.5%) are opinion leaders inside their reference group. Early Majority (34%) adopts when people like them are already in. Late Majority (34%) adopts under economic or social pressure. Laggards (16%) adopt last or never adopt at all. The percentages are statistical conventions; the conceptual profiles have held up across six decades of replication.
What is the chasm in Crossing the Chasm?
The chasm is the discontinuity between Early Adopters and Early Majority that Geoffrey Moore named in his 1991 book. It exists because the two segments have structurally different decision rules: Early Adopters buy on vision and status; Early Majority buys on pragmatic peer evidence from people like them. Early Adopter advocacy does not transfer to Early Majority because Early Adopters do not look like Early Majority. Moore’s prescription is to pick one narrowly-defined Early Majority beachhead segment and build a lighthouse-customer reference class inside it.
What are the five attributes of innovation?
Rogers identified five attributes of an innovation that predict its rate of adoption. Relative Advantage is how much better the innovation is perceived to be than what it replaces. Compatibility is how well it fits the adopter’s existing values and workflows. Complexity is how difficult it is perceived to understand and use (inversely related to adoption). Trialability is whether it can be experimented with on a limited basis. Observability is whether others can see the adopter using it. Compatibility and Relative Advantage are the strongest predictors in field studies; Observability is the most directly under designer control.
How does the Innovation-Decision Process work?
Rogers’s Innovation-Decision Process describes the five sequential stages every adopter passes through. Knowledge is first awareness. Persuasion is the formation of an attitude. Decision is the explicit choice to adopt or reject. Implementation is putting it to use. Confirmation is post-implementation reinforcement-seeking. The bottleneck stage varies by population, and most marketing budgets are over-allocated to Knowledge when the actual bottleneck is at Persuasion or Implementation.
How is the S-curve different from the bell curve?
The bell curve shows the size of each adopter segment as a slice of the population, with Innovators on the far left and Laggards on the far right. The S-curve shows the cumulative count of adopters over time, which traces an S-shape because adoption is slow during Innovator and Early Adopter phases, accelerates through Early and Late Majority, and slows again as Laggards are reached. They are the same data displayed two different ways. The bell curve highlights segment shares; the S-curve highlights timing inflections (take-off near 16%, saturation near 84%).
How does Diffusion of Innovations apply to product launches?
The model maps directly onto launch sequencing. Target Innovators first with raw, configurable, developer-friendly versions. Convert Early Adopters by making early-adopter status visible. Cross the chasm by building lighthouse-customer reference classes inside Early Majority segments. Pull Late Majority through loss-aversion framing and official-channel endorsement. Move Laggards through subtractive design and planned sunsets of the legacy option. Each segment requires a structurally different Core Drive in the design surface, which is the operational layer Rogers’s model lacks.
What are the main criticisms of Diffusion of Innovations?
Three honest critiques. First, the model is descriptive rather than prescriptive, it describes what happens when diffusion succeeds but does not specify how to cause it. Second, it carries pro-innovation bias and treats non-adoption as a failure to be explained, when many innovations should be resisted. Third, it is light on individual-level psychology and works mostly at the population and reference-group level. Pair it with a behavior-change framework (Theory of Planned Behavior, COM-B, or Self-Determination Theory) for the individual layer and with a network-science model (Bass, Centola) for the population dynamics.
How does Diffusion of Innovations connect to the Octalysis Framework?
Diffusion tells you which segment adopts in what order. Octalysis tells you which of the eight Core Drives leads at each segment. The synthesis is the per-stage Core Drive assignment: Innovators lead with Core Drive 7 (Curiosity) and Core Drive 3 (Empowerment); Early Adopters with Core Drive 4 (Ownership) and Core Drive 2 (Accomplishment); Early Majority with Core Drive 5 (Descriptive Social Influence); Late Majority with Core Drive 8 (Loss-Avoidance) and Core Drive 5 (Injunctive); Laggards with friction-removal plus Core Drive 6 (Scarcity sunsets). Spreading all eight Core Drives evenly across all five segments is the dominant failure mode and produces a design that does no segment’s job well.
References & Further Reading
- Rogers, E. M. (2003). Diffusion of Innovations (5th ed.). Free Press. The canonical text; first edition 1962.
- Ryan, B., & Gross, N. C. (1943). The diffusion of hybrid seed corn in two Iowa communities. Rural Sociology, 8(1), 15–24. The empirical seed for the entire diffusion literature.
- Lazarsfeld, P. F., Berelson, B., & Gaudet, H. (1948). The People’s Choice: How the Voter Makes Up His Mind in a Presidential Campaign. Columbia University Press. Origin of the two-step flow of communication.
- Bass, F. M. (1969). A new product growth model for consumer durables. Management Science, 15(5), 215–227. Mathematical formalization of the S-curve.
- Moore, G. A. (1991). Crossing the Chasm: Marketing and Selling High-Tech Products to Mainstream Customers. HarperBusiness. The commercial extension of Rogers’s qualitative observation of the Early Adopter / Early Majority discontinuity.
- Granovetter, M. S. (1973). The strength of weak ties. American Journal of Sociology, 78(6), 1360–1380. Foundational network-theory contribution that frames how diffusion moves across communities.
- Watts, D. J., & Strogatz, S. H. (1998). Collective dynamics of “small-world” networks. Nature, 393(6684), 440–442. Network-topology foundation for diffusion dynamics.
- Centola, D. (2018). How Behavior Spreads: The Science of Complex Contagions. Princeton University Press. The modern update to Rogers from a network-science perspective; simple vs complex contagion distinction.
- Centola, D., & Macy, M. (2007). Complex contagions and the weakness of long ties. American Journal of Sociology, 113(3), 702–734. Experimental basis for the complex-contagion theory.
- Ajzen, I. (1991). The theory of planned behavior. Organizational Behavior and Human Decision Processes, 50(2), 179–211. The individual-level companion to Rogers’s population-level model.
- Michie, S., van Stralen, M. M., & West, R. (2011). The behaviour change wheel: A new method for characterising and designing behaviour change interventions. Implementation Science, 6(1), 42. COM-B framework that complements Diffusion at the individual-bottleneck level.
- Tversky, A., & Kahneman, D. (1992). Advances in prospect theory: Cumulative representation of uncertainty. Journal of Risk and Uncertainty, 5(4), 297–323. Loss-aversion estimate that dominates Late Majority adoption decisions.
- Mohr, G. S., Lichtenstein, D. R., & Janiszewski, C. (2012). The effect of marketer-suggested serving size on consumer responses: The unintended consequences of consumer attention to calorie information. Journal of Marketing, 76(1), 59–75. Modern field evidence of diffusion-style cascade effects.
- Christakis, N. A., & Fowler, J. H. (2007). The spread of obesity in a large social network over 32 years. New England Journal of Medicine, 357(4), 370–379. Empirical demonstration of behavior diffusion through real-world social networks.
- Christakis, N. A., & Fowler, J. H. (2008). The collective dynamics of smoking in a large social network. New England Journal of Medicine, 358(21), 2249–2258. Companion study on smoking cessation as a diffusion process.
- Mokyr, J. (1990). The Lever of Riches: Technological Creativity and Economic Progress. Oxford University Press. Historical evidence for why objectively-superior innovations frequently fail to diffuse.
- Sahin, I. (2006). Detailed review of Rogers’ Diffusion of Innovations theory and educational technology-related studies based on Rogers’ theory. Turkish Online Journal of Educational Technology, 5(2), 14–23. Modern review of the theory’s six-decade trajectory.
- US Centers for Disease Control and Prevention. (2024). Current Cigarette Smoking Among Adults in the United States. Multi-decade tobacco-control data documenting the canonical multi-stage public-health diffusion case (42% adult smoking 1965 to 11.5% 2021).
- Chou, Y. (2015). Actionable Gamification: Beyond Points, Badges, and Leaderboards. Octalysis Media. The Octalysis Framework reference for the per-segment Core Drive assignment used throughout this guide.
Related Reading from the Behavioral Framework Library
- The Behavioral Framework Library, the hub of every framework in this series.
- The Octalysis Framework, the eight-Core-Drive design surface used in the per-segment assignment above.
- Theory of Planned Behavior, the individual-level decision model that pairs with Diffusion at the Persuasion stage.
- Social Ecological Model, the multi-level intervention map that complements Diffusion at the population level.
- Health Belief Model, the individual-belief framework most often paired with Diffusion in public-health campaigns.
- Sludge (Sunstein), the subtractive-design lens that does most of the work at the Laggard segment.