

The Octalysis Strategy Dashboard: 5 Elements of Engagement Design [2026 Guide]
This is Step 1 of the 5-Step Octalysis Design Process, adapted from the bestselling book Actionable Gamification.
The Octalysis Strategy Dashboard is the operational tool you use to turn the Octalysis Framework into an actual gamification design. It answers the question every designer faces after learning the 8 Core Drives: “Great — now what do I actually do?”
⚡ Speed Run Notes
- The Octalysis Strategy Dashboard is Step 1 of the 5-Step Octalysis Design Process: the minimum viable information you need before designing any gamified experience that has to move a real business metric.
- Five elements anchor every dashboard — Business Metrics (Game Objectives), Users (Players), Desired Actions (Win-States), Feedback Mechanics (Triggers), and Incentives (Rewards). Skip one and the design collapses.
- Business Metrics must be quantifiable and prioritized. “Time on page” sounds nice until you realize a solitaire widget would maximize it. Pick the wrong metric and you optimize for the wrong behavior.
- Players are not generic “users.” A 2×2 player matrix and per-segment Octalysis charts expose which Core Drives motivate each segment, and which Anti Core Drives quietly push them away.
- Rewards are the smallest lever. Boosters (rewards that improve a player’s future ability) and the SAPS hierarchy (Status, Access, Power, Stuff) outperform raw “Stuff” because they motivate more durably.
Table of Contents
- The Octalysis Strategy Dashboard: 5 Elements of Engagement Design [2026 Guide]
- About the Creator of the Octalysis Framework
- The Strategy Dashboard contains five critical elements:
- 1. Business Metrics = Game Objectives
- If You Can’t Measure It, It’s Hard To Improve It
- Boiling the Ocean Gets You No Tea
- The Refinement Process
- Cautionary Tale: Jack Welch’s Rank and Yank
- Cautionary Tale: eBay
- 2. Users = Players
- The 2×2 Player Matrix
- Creating Octalysis Charts for Your Player Types
- Identifying the Anti Core Drives
- 3. Desired Actions = Win-States
- No Step Too Small
- Motivation Energy as a Limited Resource
- The Golden Triforce
- The First Major Win-State
- 4. Feedback Mechanics = Triggers
- Feedback Mechanics Within the 8 Core Drives
- Metrics of Love
- 5. Incentives = Rewards
- A Marriage Is for SAPS
- The Best Reward: Boosters
- Boosters in Call Centers
- The Six Reward Contexts
- The Reward Value Matrix
- Putting It All Together
- Explore More Frameworks
- Related Reading
(Below is a snippet of Actionable Gamification: Beyond Points, Badges, and Leaderboards. If you like this blog post, you will LOVE the book.)
About the Creator of the Octalysis Framework

Yu-kai Chou created the Octalysis Framework after studying gamification since 2003 — years before the term entered mainstream vocabulary. As a Human-Systems Architect & Behavioral Designer, his framework has been applied by LEGO, Microsoft, Porsche, Coca-Cola, Salesforce, and MrBeast, impacting over 1.5 Billion Users.
Chou has taught the Octalysis methodology at Harvard, Stanford, Yale, Tesla, Google, BCG, and IDEO.
His work has been cited by Harvard, Stanford, MIT, Forbes, Wall Street Journal, Wired, US Department of Energy, NIST, NSF, NCBI, US Department of Education, ClinicalTrials.gov, and 3,700+ more academic publications. Explore his books here.
At this point, we have built a strong foundation for understanding the 8 Core Drives, their natures, and how they individually and collaboratively influence our behavior. However, this does not necessarily mean this knowledge can be easily applied to designing an engaging gamified experience that also fulfills business metrics. For that, we need another tool.
After some of my talks on Octalysis, people often ask me, “How do I actually start to design a gamified campaign with the 8 Core Drives? I can now create an experience that’s interesting and engaging, but I’m not sure how that will drive business success.”

In order to design a successful project, they need the Octalysis Strategy Dashboard.
The Octalysis Strategy Dashboard is the first step of the 5-Step Octalysis Design process and the foundation for every engagement project. It’s a constantly evolving document that clarifies the most important aspects of your gamification campaign by focusing your attention on the critical elements that direct your efforts for maximum impact.
Think of it as the “minimum viable information” needed to create an engaging design.
The Strategy Dashboard contains five critical elements:
- Business Metrics, leading to Game Objectives
- Users, leading to Players
- Desired Actions, leading to Win-States
- Feedback Mechanics, leading to Triggers
- Incentives, leading to Rewards
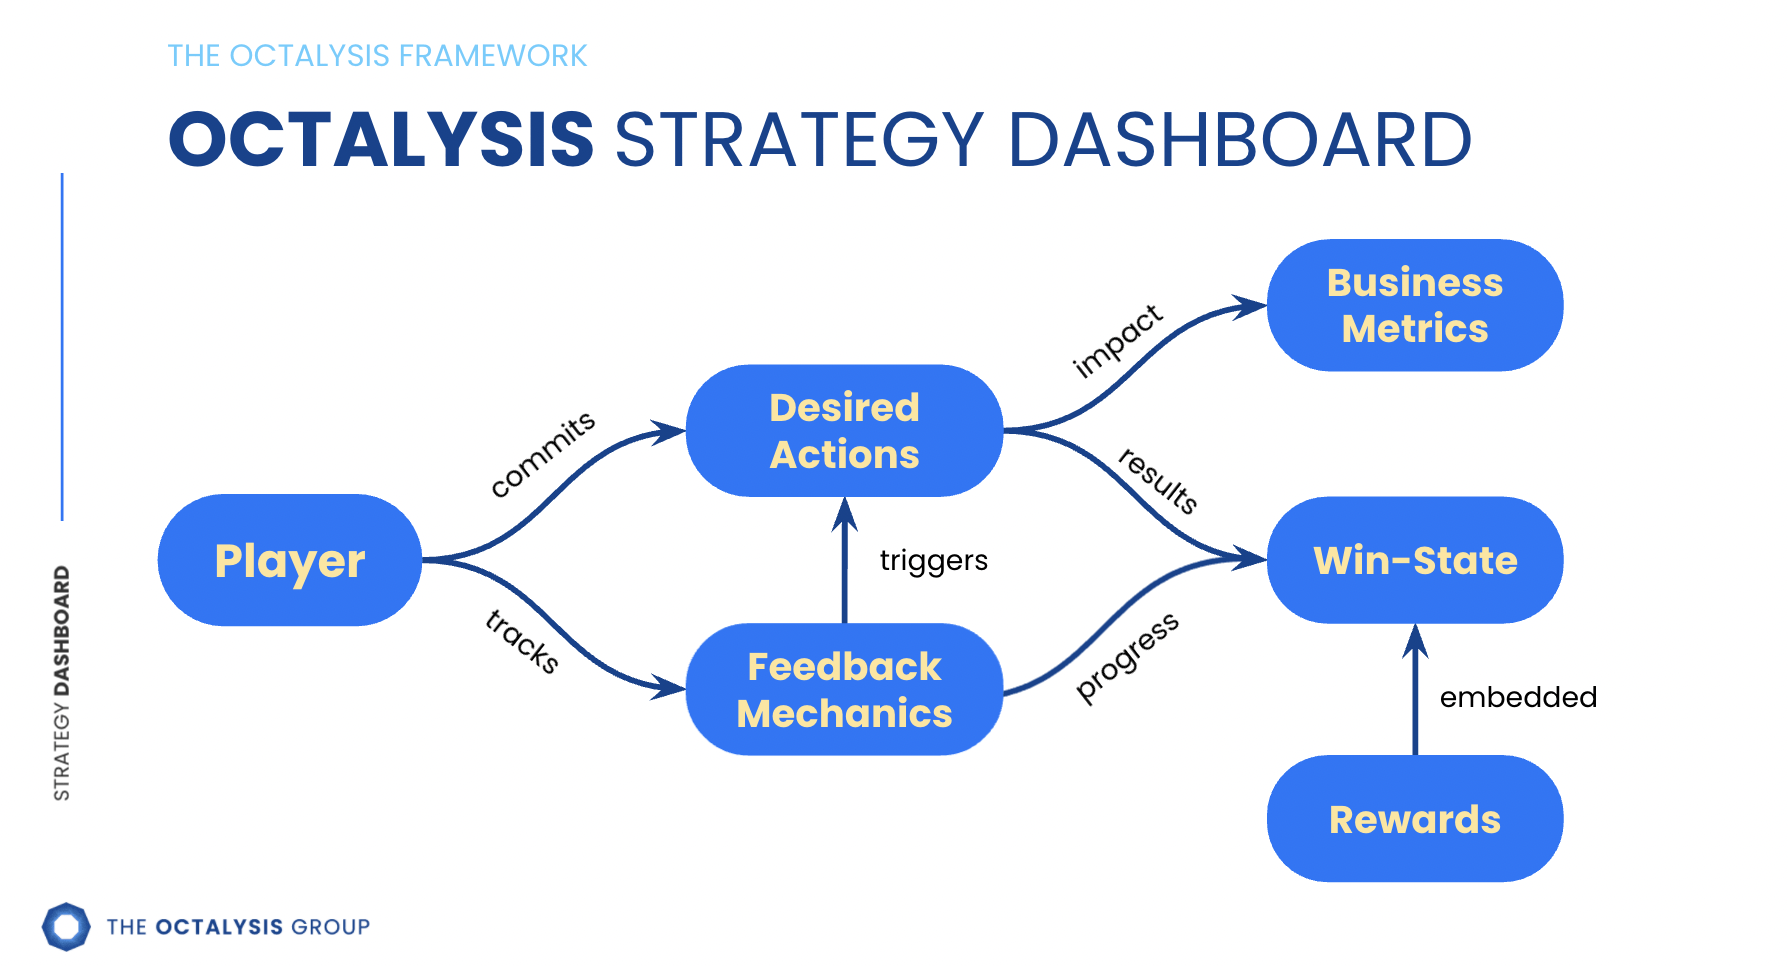
Your Strategy Dashboard is not meant to be as comprehensive or as static as a business plan. It should provide a minimum amount of critical information to help you execute an actionable gamification campaign that drives your business metric goals.
It may take less than one or two hours to first define your Strategy Dashboard but can take months of iterations as your product or service evolves.
Let me explain each of the dashboard’s critical elements in turn:
1. Business Metrics = Game Objectives
Business Metrics are the key numbers and results that the business wants to improve on. These are high-level items that the company may present to its executives or investors in order to show the campaign’s success.
Some Business Metrics include revenue, daily active users over monthly active users, time spent on site, retained users, registrations, etc. Again, these are the numbers that indicate success for your business. If these numbers are growing, your business is in good shape.
When defining Business Metrics, make sure that the majority of your Business Metrics are quantifiable and prioritized in order of importance.
If You Can’t Measure It, It’s Hard To Improve It
Sometimes clients ask me which gamification platform they should use to develop their campaign.
I believe the answer depends on what problem they want to solve. The problem isn’t that there is a lack of gamification. If that’s the problem, then it doesn’t matter what platform you use: as long as you include any kind of gamification, your problem is solved!
Business metrics cannot be fluffy statements such as, “We want to make people feel great!” It should be measurable and quantifiable. You need to be able to track success, benchmark against other campaigns, and even run split tests to see which of your efforts produce the best results.
Boiling the Ocean Gets You No Tea
Business Metrics also need to be prioritized in the order of importance to your business.
Most companies want all of their metrics to grow exponentially: they want a lot of revenue, new users signing up, more user time spent on their site; they want everything.
However, at this stage, it is important to focus on defining your top Business Metric, your number two Business Metric, and so on. Design is about trade-offs. When it comes to designing for motivation, oftentimes you can only optimize for one Business Metric at each interface, and so you have to refer back to your dashboard and be disciplined enough to choose your most important one. You can of course improve all the other Business Metrics to large degrees too (even better than all other companies), but you can only optimize for one of them.
A good example of this is a login interface on the front page of your website. Is your top Business Metric to increase new user signups or to maximize weekly return rates? If you have decided the former is a higher business metric, you may design the interface that provides a text box for easy user registration with a simple “Sign-up” and “Sign-up through Facebook” button next to it. You would include a smaller section that says, “Already a user? Login here.”
If your top Business Metric is to maximize daily returns, then the interface may be the opposite, with a small section that says, “Not a user yet? Sign up here!” This design may not be the best solution to maximize daily returns for all scenarios, but you can see how an interface can often only allow for a single optimization of a key Desired Action.
If you look carefully at various front pages, you will see that Facebook, Pandora, and X (formerly Twitter)’s home pages are optimized for new user signups: large signup forms, prominent call-to-action buttons, with a smaller “Already have an account? Log in” link. The same pattern continues today with Spotify, TikTok, and Notion, all optimized for new user acquisition. Meanwhile, Amazon and PayPal’s home pages are optimized for returning user sign-ins.
As eCommerce solutions, Amazon and PayPal decided that there is a higher return when an existing user logs in and spends money, as opposed to having a random person sign up just to see what their platforms are about. More often than not, a first-time user won’t generate as much commercial activity as an active user.
Obviously their other business metrics will also be increased through this optimized interface, but we want to always design in the main Desired Action for the user so that they always have a clear sense of how to reach the Win-State. If you try to get users to do everything on one screen, users will face decision paralysis, leave your site, and go back to their comfort zone.
Ideal count: 3–8 metrics. Too many and your focus is diluted. Too few and you may be missing critical dimensions of success.
The Refinement Process
Defining Business Metrics isn’t just a brain dump. It’s an iterative process:
- Brain dump: Write all possible metrics without worrying about priority
- The Success Test: Ask: “If my top metric is doing extremely well but others are mediocre, am I still successful?” This reveals what matters most.
- Separate ends from means: Push “means” metrics lower. Time on page is a means; conversion is an end.
- Check for unintended consequences: Will optimizing this create perverse incentives?
- Quantify fuzzy metrics: “Sharing” becomes “Number of users who share on social media within 24 hours.” “Buzz” becomes “Number of external articles written about the platform per month.”
- Add conditions: “Revenue” becomes “Recurring revenue of $20K/month within 6 months.”
Cautionary Tale: Jack Welch’s Rank and Yank
GE famously rewarded the top 20% of performers and fired the bottom 10% annually. From a function-focused design perspective, the logic seems sound: the organization can only get better over time.
But from a human-focused perspective, something different happened. People we talked to who worked at GE at the time told us that everyone just started intentionally hiring mediocre people as a “cushion” against being in the bottom 10%.
Brilliant candidates were avoided because they’d push everyone else down the ranking. The metric created the exact opposite of its intended behavior.
This is why understanding human motivation, not just business logic, is critical when defining your metrics.
Cautionary Tale: eBay
When I worked with eBay’s quality team, they initially told me their top metric was “time on page” for the seller dashboard. I challenged them: “Then you can just put a solitaire game on your dashboard? That would increase time on page dramatically.”
They laughed, but it revealed an important truth: their real metric was reducing bad buying experiences, measured by complaints and disputes. “Time on page” was a proxy metric masquerading as the real goal.
If by implementing your gamified campaign your Business Metrics have not improved, then you have failed the Game Objective.

Watch Yu-kai Chou explain the Strategy Dashboard and Business Metrics in his 2020 Masterclass series.
2. Users = Players
Users are the second element to define within the Octalysis Strategy Dashboard.
This may only require broadly defining your users by gender, profession, or even subject interest, but can also entail more detailed and in-depth user specificity through using Richard Bartle’s Four Player Types (Achievers, Explorers, Socializers, Killers), Andrzej Marczewski’s Six Player Types (Disruptors, Socializers, Achievers, Free Spirits, Players, Philanthropists), or Myers-Briggs MBTI personality types.
If you use Bartle’s framework here, it’s worth pairing it with a Core Drive–level reading of each player type so your dashboard captures not just what each user does, but why.
In Enterprise Gamification, Mario Herger states that it is important to have the key personas of your target user identified.
Whatever model you use to define your users, make sure that you define your user categories based on how they are differently motivated. You don’t want groups that seem different but are motivated in a similar fashion. This will make it more difficult to optimally design Desired Actions for the Win-State.
For instance, employees are likely more motivated based on their positions in the company than by gender. As a result, it may be more productive to divide the users into “Managers” and “Workers” rather than “Males” and “Females.” This might be the reverse if we were designing for a traditional dating site.
The 2×2 Player Matrix
One of the most effective ways to define your player types is to create a 2×2 matrix with two key differentiating dimensions relevant to your product.
For example:
– Expertise level (novice → expert) × Motivation type (intrinsic → extrinsic)
– Tech savviness (low → high) × Social orientation (individual → collaborative)
– Commitment level (casual → power user) × Primary goal (learning → earning)
This produces four distinct player quadrants, each needing different Core Drive emphasis in the design. The key is choosing dimensions that actually predict different motivational profiles, not just different demographics.
Creating Octalysis Charts for Your Player Types
Once you have identified your users, you can start to apply custom Octalysis Charts for all these players using the Octalysis Tool (this can be found at yukaichou.com/octalysis-tool).
By considering which of the 8 Core Drives motivates which user types more, you can then identify and implement game elements that appeal best to those Core Drives.
Keep in mind that it is still possible to appeal to the Core Drives that are not used often, since all of the Core Drives motivate people to different extents. However, it is often easier to motivate people with drives that they’re already accustomed to (unless they are longing for something else in their lives).
This is really where context matters. For instance, the average self-selected accountant likely wants to feel smart and organized (Core Drives 2 & 4) and usually does not like the sense of uncertainty (Core Drive 7: Unpredictability), especially compared to the average self-selected artist.
A salesperson might be more driven by competition (Core Drives 2 & 8) through leaderboards, while a customer support agent might be more driven by Social Influence & Relatedness (Core Drive 5) through customer satisfaction scores and team goals.
Personal Assistants are motivated similarly but perhaps a bit more influenced by Social Influence and Relatedness (Core Drive 5), both towards the person they are assisting as well as the people they are interacting with on a daily basis.
Identifying the Anti Core Drives
Beyond developing an Octalysis Chart for each user type, it is also advantageous to create an Anti Core Drive Chart.
The Anti Core Drives are basically why users do not want to commit the actions you want them to. Since every single action you take is based on one or more of these 8 (+1) Core Drives, this means that when they don’t do something, they are likely not doing it because of one of the 8 Core Drives as well.
Oftentimes people do not commit the Desired Actions because of Status Quo Sloth. They simply don’t want to change due to behavioral inertia. When Status Quo Sloth is designed in your own campaign, it is an Endgame technique that prevents people from leaving your system. When it is part of an Anti Core Drive, it prevents people from joining your system.
When you identify that a person’s Anti Core Drive is Loss & Avoidance (Core Drive 8), your system can attempt to turn it around by conveying that they would be losing more if they did not take action immediately. (Note: this is clearly Black Hat Gamification and should not be used without understanding its implications.)
Similarly, if someone’s Anti Core Drive is Epic Meaning & Calling, it may not be useful to use other Core Drives to motivate them.
The key insight: You often should address the Anti Core Drive first, before layering on additional motivators. If someone resists for reasons of Epic Meaning & Calling (Core Drive 1), no amount of social pressure (Core Drive 5) or achievement rewards (Core Drive 2) will move them. The reason they refuse is for something bigger than personal gains, social status, or enjoyment. Address that resistance directly, and then the other Core Drives can take effect.
If you are trying to encourage a person to drink at a company gathering, and he says, “No, I can’t drink alcohol because I just became a Christian.” It often doesn’t matter if you appeal to the other Core Drives by saying, “Come on! All your friends are drinking!” (Core Drive 5: Social Influence & Relatedness) or “You’ve earned it through high performance!” (Core Drive 2: Development & Accomplishment) because the reason why he refuses is for something bigger than his own personal gains, social status, or enjoyment.
Rather, it may be more fruitful to address the Anti Core Drive of Epic Meaning & Calling by saying, “Really? I thought Christians could drink. Wasn’t Jesus’ first miracle turning water into wine? And didn’t he give his disciples wine in the last supper and say it symbolized his blood? As far as I know, Christians can drink…just not get drunk.” (Disclaimer: I myself am of the Christian faith).
Once you have addressed the Anti Core Drive, then you can add other Core Drives like Social Influence & Relatedness: “See, our other colleague over there has been a faithful Christian who fasts and tithes regularly for twenty years, but he drinks a little wine at company events from time to time. Why don’t you just take this wine glass, and we won’t ask you to drink more beyond that?” (Note: make sure to remember the lessons learned in Chapter 15 on the Moral and Ethics of Gamification, especially if the scenario involves a form of manipulation like above).
Another example is seen in the Disney movie Saving Mr. Banks (Spoiler Alert). In the movie, Walt Disney, played by Tom Hanks, is only able to convince Mrs. Travers, played by Emma Thompson, to assign him the rights of her popular novel Mary Poppins when he finds out the real issue of her resistance: her history with her father and the inability to forgive herself (Core Drive 4: Ownership & Possession and Core Drive 5: Social Influence & Relatedness).
Walt Disney finally persuades her, after twenty years of rejection, by incorporating her issue in his movie, Mr. Banks. He has the main character, symbolizing Mrs. Travers’s father, find redemption in a happy ending. Note that another motivator in Saving Mr. Banks behind her decision to meet with Walt Disney was Core Drive 8: Loss & Avoidance, as she was running out of money and needed to keep her house.
By understanding why the user does not take the desired actions, one can address it authentically and constructively engage the issue instead of chasing around the bush on topics that are irrelevant to the user.
Once the Users are defined, you now have the Players for the gamified system.
Critical Rule: Design for your player types across all four phases of the user journey (Discovery → Onboarding → Scaffolding → Endgame). A player type’s dominant Core Drives may shift between phases.

3. Desired Actions = Win-States
Desired Actions are the third element to define in any Octalysis Gamification campaign.
Desired Actions are the little steps you want users to take: go onto the website, fill out the form, register, come back every day, click on the ad, sign up for the newsletter, complete their profile, invite a friend, make a purchase, leave a review, etc.
These are different from your Business Metrics because “Clicking the Okay Button” is hardly a success metric that you would report to your investors. But to your users, Desired Actions are a commitment they can choose to do or choose not to do.
Whereas the Business Metrics are laid out in the order of importance, you want to lay out all the Desired Actions in chronological order based on the player’s journey. This is important because oftentimes what happens ten minutes before a Desired Action will significantly affect whether the user will do it or not.
No Step Too Small
One thing to remember when defining Desired Actions is that no action is too small to be included.
Sometimes my clients ask me if one of their steps is too small to be defined as a Desired Action. How much value should be assigned to a simple clicking of a button?
If you dismiss that button-click as too small and do not design motivation towards it, you can disrupt all further progress, and as a result, the user may drop out as she is no longer motivated towards subsequent actions.
In Octalysis Gamification, each Desired Action leads to a Win-State.
This means that every time the user commits the Desired Action, she has reached a Win-State and may receive some type of reward.
Note that when a user commits the Desired Action, at least according to my own system, they automatically hit a Win-State. However, whether the Win-State is rewarding or not is undefined at this point.
The designer has to make sure that when the User hits the Win-State, there is a gratifying experience that reinforces their behavior. With badly designed experiences, the user commits a Desired Action, hits the Win-State, and then receives a punishing experience within that Win-State.
Think about employees who are encouraged to take risks but get chastised when they fail, or web users that click on a flashy glowing “friends” button, just to see a page that says, “You have no friends.”
We will talk about how to make the Win-State actually rewarding for users when we cover Incentives and Rewards below.
Motivation Energy as a Limited Resource
Here is one of the most practical mental models for designing Desired Actions: treat user motivation as a finite, measurable resource that depletes with every action and must be replenished through the 8 Core Drives.
Think of it like a battery meter. Users arrive with varying levels of “motivation energy” depending on how they discovered your product:
- High motivation: Their best friend told them this changed their life → they’ll fill out a 40-minute survey due to a high sense of initial motivation.
- Medium motivation: They read a compelling article about your service → they’ll give you a few minutes to prove your value.
- Low motivation: They clicked a random ad → they’ll bounce after 4 seconds if no other Core Drive kicks in after the initial curiosity (CD7).
Now here’s the crucial part: every click, every scroll, every form field, and even brain cycle costs motivation energy. If the next step doesn’t replenish motivation through one or more Core Drives, users run out and leave.
This means you need to map out the sequence of Desired Actions alongside the motivation energy cost and replenishment at each step. If you see a chain of desired actions with no emotional payoff between them, users will drop out. Each chain needs a reward or payoff moment that refuels the motivation battery.
The Golden Triforce

Whenever you are designing a gamified campaign, the Win-State in the user’s mind should always be accomplished by committing the Desired Action, which increases your Business Metrics. These three elements should always be aligned.
Now, this may seem intuitive, but you would be surprised to learn how many companies do not have these elements streamlined together.
When a client asks me, “Hey Yu-kai, why don’t we add this really cool feature! Users will love it!” I often respond, “How does this motivate users to commit the Desired Actions, and how does this help you improve your Business Metrics?”
More often than not, the client says, “Hm, I guess the feature doesn’t add much. It’s just a really cool idea.”
Consequently, I regularly get approached by companies telling me, “Yu-kai, we’re from company X. We really believe in the power of gamification and have tried a few different campaigns. Our users love it and everyone engages with our campaign on our social media platforms. However, we seem to have a hard time getting them to do the next step, which is actually signing up on our website. Do you know what we are doing wrong?”
More often than not, they do not have the Golden Triforce aligned.
And this, again, is actually the core difference between Games and Gamification. Games can simply be fun and engaging, but gamification has to improve your Business Metrics, and it has to drive behavior towards a certain productive activity. If a gamification feature is not designed to improve your Business Metrics, it is a distraction and needs to be taken out, or else the gamification campaign will become useless and fluffy.
The First Major Win-State
One of the key practices to define your Win-States is to identify the First Major Win-State. The First Major Win-State is when a user first says, “Wow! This service/experience is awesome!”
Interestingly, many businesses scratch their heads and think of whether they even have Major Win-States. If your experience does not offer any Major Win-States, your experience is not emotionally compelling.
Once the First Major Win-State is determined, you want to count exactly how many minutes it takes for users to reach that First Major Win-State. This is essential, because with every second that goes by before a user hits the First Major Win-State, there will be dropout. The longer it takes to reach this experience, the higher your dropout rate will be.
Product managers or startup founders can be biased on where they believe the First Major Win-State should be. They have a tendency to think that everything a user goes through is awesome, which more often than not does not reflect the actual experience.
Creating a profile is not a First Major Win-State. Uploading a photo is not either. If it was 20 years ago, uploading your photo might be a First Major Win-State. “Wow! I can see my photo on a screen!” Not in today’s world, unfortunately.
Even for a music discovery site like Pandora, the First Major Win-State is not where you first enter the music you like, nor the part where you hear your first song being played.
The First Major Win-State happens when Pandora has played four to five songs, and you realize that you liked every single song it played. This might include one or two songs you’ve never heard of before. That’s when you say, “Wow! Pandora is awesome!”
The same principle applies to modern services. Consider Spotify’s Discover Weekly playlist: the First Major Win-State isn’t when you first open the app, or when you pick your favorite genres, or even when the first song plays. It happens when Spotify has played four or five songs, and you realize you loved every single one, including one or two you’d never heard before. That’s when you say, “Wow, Spotify really gets me!”
Strong Win-State design is critical for the success of a gamification campaign, and their identification and masterful creation is fundamental in Level 4 Octalysis.
4. Feedback Mechanics = Triggers
Feedback Mechanics are the fourth element to define in any Octalysis Gamification Campaign.
Feedback Mechanics are cues (often visual, but can be audio or use other senses) that help users track their progress towards the Win-State. These often come in the form of points, badges, levels, trophies, progress bars, and even avatars. In the end, Feedback Mechanics are meant to Trigger users to commit more Desired Actions.
Of course, people may ask, “I don’t have a gamified campaign yet! How will I know what Feedback Mechanics or Triggers to implement?”
Not to worry. This is why the Strategy Dashboard is a constantly evolving document. Business Metrics may adjust to reflect new needs, User information may become more in-depth with more research, Desired Actions often increase, and Feedback Mechanics are fully fleshed out.
That said, at the initial stage of your Strategy Dashboard creation, you should identify any preliminary Feedback Mechanics that will help your user understand the results of their actions. These could be a grade, a year-end report, a handshake, a welcome email, a search result, or a thank-you page.
If you don’t have any Feedback Mechanics in your motivational system, things are dire indeed, and I’m glad you are reading this.
Feedback Mechanics Within the 8 Core Drives
Feedback Mechanics can variously affect different Core Drives:
Core Drive 1: Epic Meaning & Calling. Visually showing a user all the people that are being helped by the Desired Actions they are committing. This is why when you donate money to disadvantaged children in developing countries, many organizations will send you pictures of the child being helped along with a handwritten thank you note.
When you donate through a platform like charity: water, they send you GPS coordinates showing exactly which well your money funded, along with photos of the community now using it. That’s a powerful Feedback Mechanic for Core Drive 1.
One of the cool things about the language learning app Duolingo is that it used to allow users to seamlessly translate real web content as they were learning. That was a great form of Epic Meaning & Calling: you weren’t just learning Spanish, you were translating the English Wikipedia into the Spanish Wikipedia!
However, I was constantly surprised by how many people I know who used the app and didn’t know about this feature. Upon learning about it, they often told me how much more they loved the app. (Note: Duolingo has since phased out this crowdsourced translation feature, but the principle remains powerful.) I’m not sure why Duolingo didn’t implement Feedback Mechanics that communicated this Core Drive 1 to their users. Perhaps they could have included a metric that read, “21,000 Words Translated on the Internet.” I imagine their usage and retention rates would have increased if they did.
Core Drive 2: Development & Accomplishment. Points, badges, trophies, and progress bars. LinkedIn’s profile completion bar is a classic example: “Your profile is 70% complete” drives users to fill in more fields. But make sure these Feedback Mechanics actually track actions that are meaningful, not useless things that the user couldn’t care less about.
Core Drive 3: Empowerment of Creativity & Feedback. The response generated from a creative action serves as a Feedback Mechanic. These are generally the output of Meaningful Choices, which allows the user to make adjustments and get feedback on their decisions.
Canva does this well: every design choice produces an immediate visual result. If the user feels like they aren’t receiving meaningful or timely feedback from their actions, Core Drive 3 will not prevail.
Core Drive 4: Ownership & Possession. The representation of what is owned: virtual sheep, stock symbols, dollar signs, stamps, portfolio value, inventory screens, profile pages, or collections. Robinhood’s portfolio graph, Notion’s personal workspace, or a game inventory screen all create a sense of ownership that users want to grow and protect. Sometimes these Feedback Mechanics show users that the system is continuously learning about their preferences.
Core Drive 5: Social Influence & Relatedness. Showing how many likes, endorsements, or pageviews one has, or perhaps statistics on a group’s actions (think Kiva.org and their micro-loan communities). Strava’s activity feed, GitHub’s contribution graph, and Duolingo’s friend leaderboards all use social feedback to drive engagement.
Core Drive 6: Scarcity & Impatience. A countdown timer, a lock icon, a gatekeeper, a moat, or a “limited availability” indicator. Booking.com’s “Only 2 rooms left!” or a flash sale countdown timer all instill urgency.
Core Drive 7: Unpredictability & Curiosity. A mystery box, spinning wheel, dice, or question mark. Gacha mechanics in games, or even Netflix’s “Play Something” button, tap into the user’s curiosity about what might come next.
Core Drive 8: Loss & Avoidance. Lost progress indicators, streak counters (miss a day and you lose it), sad tunes, physical penalties, or warnings about expiring benefits. Duolingo’s streak counter is perhaps the most well-known example: miss one day and your 200-day streak is gone.
If you show users how much time they have already spent on the product, it will also make it more difficult for the user to quit and give it all up. Note: this only works if the user feels proud of the time they already spent there. Showing users that they wasted 2,000 hours on a mindless casino slot machine game might actually trigger an epiphany that causes the user to quit (which becomes an Anti Core Drive).
Metrics of Love
One important thing to keep in mind is that the User Metrics should align as much as possible with the Desired Actions and the Business Metrics. The Feedback Mechanics you show users should be things users actually care about.
Don’t show users metrics that make them feel bad about their time spent. You don’t want to include “How much total money you were penalized by returning your DVD to the rental store late in the past 5 years” as a long-term engagement User Metric, since Loss & Avoidance will not make users feel good in the long run (this can be compelling if your number one Business Metric is to get people to return their DVDs on time). While that specific example is dated, the principle remains: modern equivalents might be showing a user their total subscription cost over three years, or their screen time on a mindless app.
Rather, it is better to display top movies that the users ordered by genre, reviews of those, and better recommendations for future movies to rent. Show them what they’ve accomplished, how they’ve grown, or the impact they’ve created while using your system. Can you think of a service that implicitly deployed the former model, and a service that explicitly deployed the latter one?
Again, no matter what the Feedback Mechanics are, they should motivate users and be relevant to the flow of the experience. In addition, they should all be Triggers for users to further take the Desired Actions.
5. Incentives = Rewards
Incentives are the fifth and final element to define in the Octalysis Strategy Dashboard. Incentives are what you can give users within your power that rewards their behavior and entices them to further action.
The phrase “within your power” is important, because every company has limitations. Even the largest Fortune 500 firms who easily give users cash may not be able to put users’ names on their website or give them early access to a new product (often that is trapped in corporate bureaucracy).
After you have determined what you can give users, you obviously don’t want to give them everything at the beginning. You want to strategically place these incentives across the different Win-States to motivate players to feel great about committing the Desired Actions.
These Incentives become Rewards in a game, and as mentioned before, rewards do not have to be merely physical rewards such as gift cards or cash, which is what most companies default to. Rewards can be physical, emotional, intellectual, or even spiritual.
A Marriage Is for SAPS
A catchy model to think about rewards is Gabe Zichermann’s SAPS model: Status, Access, Power, Stuff.
The interesting thing about SAPS is that as you go from Status to Access to Power to Stuff, the reward becomes more expensive for the company, but less sticky for the user.
It costs nothing for me to tell you that you are amazing and you’re the #1 User on my site, and you will likely be excited about it for weeks or months and tell all your friends about your new status.
But if I gave you cash, you likely will become excited for a few hours or a day, and then you may spend the money at a mall and then emotionally forget about it. Now your emotional state is wondering about when you will receive your next injection of cash.
Again, most companies default to giving people “stuff” as incentives, but it’s actually far more effective if you can figure out how to give them more status, exclusive access, or more power to control their environment.
The Best Reward: Boosters
From my own experience, the best type of reward is what I call Boosters: rewards that help reinforce the Desired Actions and loop you back into the ecosystem.
We already know that cash is not the best incentive because once the user hits the Win-State and takes their cash, they won’t care about the Desired Actions anymore (unless they are strung by the next carrot). Even with Status, sometimes when a user works hard towards a status reward and finally achieves it, she now feels like she has proven she can do it and decides to quit after that.
When Starcraft II came out, I started playing it as I was such a big fan of Starcraft I in my teenage years. I played it rigorously and tried to master my play. I also tried to climb the leaderboards, going from Copper League to Bronze League to Silver League to Gold League, and finally to Diamond League, which was the highest league at the time. After a bit more play, I was ranked a Top 5 Player within my Diamond League Division (out of a hundred players). At that point, I took a screenshot to prove I had done it, and quit the game forever so I could focus on my work again.

As you can see with this example, as soon as I hit the Win-State, the reward actually demotivated me to continue playing.
Therefore, I believe the best type of rewards are those that help reinforce the Desired Actions and loop you back into the ecosystem.
In games, when a person plays a game and works hard towards defeating a thousand monsters, oftentimes his reward is a powerful sword. At that point, it makes zero sense for the player to quit the game. The only thing that makes sense is for the user to take that powerful Booster, go back into the game, and defeat more monsters, faster.
FarmVille, the Facebook game Zynga ran from 2009 until it shut down on December 31, 2020, was built on this. Users started out growing a small farm, one square at a time. But as the user continued to commit the Desired Actions and hit the Win-States, his farm started to expand and he was able to plant more plants. That in itself was a Booster and encouraged the user to come back and play more upon receiving each reward.
However, as the farm size expanded, it became more labor intensive to take care of the farm. Then suddenly, after weeks or months of hard work, the user finally unlocked the next reward: a tractor! This tractor allowed the user to farm four squares upon each click, instead of one square per click. Now it was much easier to commit the Desired Actions!
Again, at that point, it made zero sense for the user to rejoice and quit the game. The only thing that made sense was for the user to go back to the game and commit more of the Desired Actions to farm faster, until he unlocked the next tractor which could farm nine squares at once.
FarmVille is gone, but the same Booster design is alive in Stardew Valley, the farming game ConcernedApe released in February 2016.
You start the game watering every crop by hand with a watering can. Once your Farming skill reaches level 2, you can craft a Sprinkler that waters the four tiles around it every morning.
At Farming level 6 you unlock the Quality Sprinkler, which covers eight tiles, and at level 9 the Iridium Sprinkler, which covers a 5×5 area of twenty-four.
Every sprinkler hands back the time you used to spend watering, and the obvious thing to do with that time is plant a bigger farm. The reward sends you straight back into the Desired Actions, which is exactly the job of a Booster.
Boosters in Call Centers
The principle of Boosters can be applied to reward structures in the real world too. I regularly talk to Call Centers that want to motivate their cold callers and decrease their turnover rates.
Cold calling is like the anti-game. Games are usually about positive reinforcement and incentives, while cold calling is often about continuously being rejected, yelled at, and hung up on. It’s easy to feel demoralized and quit the job.
Now there are many ways to make the experience intrinsically more rewarding by using the 8 Core Drives, but for the sake of this section, we’ll instead focus on using Boosters to “upgrade their gear” in place of the common tactic of using money as the primary incentive. I should note that even though cash has been proven to be far from the strongest motivator, taking peoples’ cash away is definitely one of the strongest demotivators. Once you pay people a certain amount, lowering that pay becomes detrimental.
For instance, the best cold callers would have the most expensive tables and the most comfortable chairs. Their call station should have the most high-tech upgrades, and they perhaps can just press a button on their headset and talk directly to the supervisor, while others have to walk to the supervisor’s office to talk to her.
This is also a Status upgrade, as everyone who walks by the caller’s station would think, “Wow, that’s a top level salesperson!” And of course, the caller would think in response, “That’s right. I’m a top level salesperson.”
Now in this sense, even if the caller was offered a slightly higher paying job, he may not want to leave because if he joins the new company, he would lose all his high quality gear and immediately become a newbie again.
When you design for incentives, think about rewards that empower the Desired Actions and create a gratification loop that continuously builds on itself.
The Six Reward Contexts
While SAPS describes the nature of the reward, there’s also a variety of Reward Contexts that can be derived from the 8 Core Drives of Octalysis. Through my years of designing engagement systems, I’ve identified six distinct types of rewards, each triggering different motivational responses:
1. Fixed Action Rewards (Earned Lunch)
The user knows exactly what they’ll get for completing an action. “Complete 10 lessons, earn the Gold Badge.” This is straightforward and uses Core Drive 2 (Development & Accomplishment). Predictable, clear, but can feel transactional over time.
2. Random Rewards (Mystery Box)
The user knows they’ll get something, but not what. This creates delight through unpredictability (Core Drive 7). Works best for low-commitment desired actions: pulling a lever is fine; a month of hard work for a random reward feels unfair.
3. Sudden Rewards (Easter Egg)
A reward the user didn’t know was coming. This has the highest delight potential because it’s a true surprise. The user wasn’t expecting it, so there’s no entitlement, only joy. However, you can’t rely on Easter Eggs for motivation, since users don’t know they’re coming. Use them to create memorable moments.
4. Rolling Rewards (Lottery)
A reward that compounds or builds over time, creating anticipation and continued engagement. Streak bonuses, compound interest, or loyalty tiers that unlock progressively better benefits. Starbucks Rewards tiers are a good example: the more you engage, the better the rewards get.
5. Social Treasure (Gifting)
Rewards you can only claim through social interaction. A friend sends you bonus lives, or a team achievement unlocks rewards for everyone. This drives Core Drive 5 (Social Influence & Relatedness) and creates organic viral loops.
6. Reward Pacing (Collection Set)
The strategic distribution of reward timing throughout the user journey. Mix immediate small rewards with delayed large ones. Too many rewards too fast devalues them; too few too slow loses users. This is an art, not a science, and requires iteration.
We have seen how these reward contexts play into a variety of Core Drives, and they are all meant to be defined in the Incentives and Rewards section of the Octalysis Strategy Dashboard.
These reward contexts are derived from Octalysis, because we are all incentivized by the Core Drives. Even if it’s not something you gain, avoiding a loss or satisfying your curiosity are also strong rewards that can be strategically placed in every single one of your Win-States. Without them, users will have no reason to commit the Desired Actions moving forward.
The Reward Value Matrix
For each potential reward, evaluate three dimensions:
– Value to User: How much do they actually want this?
– Value to Organization: How much does it cost you to provide this?
– Abundance: How freely can you distribute this?
Match high-value, low-abundance rewards to your hardest Desired Actions. Match low-value, high-abundance rewards to frequent, easy actions. This prevents reward inflation and ensures your most powerful incentives are reserved for the moments that matter most. (For more on designing reward economies, see the Economy Design Framework.)

Watch Yu-kai Chou break down the six Reward Contexts in his Strategy Dashboard Masterclass.
Putting It All Together
Before you do any audit of your product or design a new campaign using the Octalysis Framework, I highly encourage you to go through the Octalysis Strategy Dashboard to understand how you can align your behavioral design strategy with your actual goals. Even if you decide to hire consultants who are extremely knowledgeable in Octalysis, if you can’t decide on what your Business Metrics are, who your Users are, and what Desired Actions you want users to take to become successful, there is little that the consultant can do for you.
The Strategy Dashboard is a living document, not a one-and-done step. You continuously return to it as your understanding evolves. But getting the initial priorities right saves enormous rework downstream.
Remember: if you change which Business Metric is #1 versus #3, the entire design may need to change. This is why the Strategy Dashboard comes before any brainstorming, before any feature design, before any implementation.
The five elements work as a system:
- Business Metrics tell you what success looks like
- Players tell you who you’re designing for and what motivates them
- Desired Actions tell you the specific steps that drive those metrics
- Feedback Mechanics tell users where they are and trigger the next action
- Rewards reinforce behavior and loop users back into the experience
When these five elements are aligned and designed with the 8 Core Drives of Octalysis in mind, you create experiences that people actually want to return to.
That’s the difference between gamification that changes behavior and gamification that’s just decoration.
Updated 7 October 2026. Every outside link on this page was checked. The Octalysis Group link now goes straight to its own Strategy Dashboard page instead of an old domain that redirected to its homepage.
Updated 8 October 2026. Dated the FarmVille example in the Boosters section to the years the game ran (2009 to 2020) and added Stardew Valley’s sprinklers as a current example of the same Booster loop.
Four internal links were also corrected: the $1.06 Billion case study and the frameworks hub each pointed to the Octalysis Framework page, and two Octalysis Framework links went through a redirect.
Explore More Frameworks
Discover all of Yu-kai Chou’s frameworks and models at Frameworks & Models by Yu-kai Chou.
Related Reading
- What is Gamification? Definition, Examples & Framework
- Actionable Gamification: Beyond Points, Badges & Leaderboards
- 90+ Gamification Examples & Cases with ROI Stats
- The $1.06 Billion Octalysis Gamification Case Study
- Economy/Tokenomics Design Framework
- The Digital Convergence Model
- 10,000 Hours of Play: Unlock Legendary Success
The Octalysis Strategy Dashboard is Step 1 of the 5-Step Octalysis Design process, which is detailed in Actionable Gamification: Beyond Points, Badges, and Leaderboards. For hands-on training in applying the Strategy Dashboard to real projects, visit The Octalysis Group.
🎮 Learn the Octalysis Framework →