

Ask ten people in 2009 whether they’d spend three hours a day clicking on virtual cows, and ten people will say no. Ask them if they’d pay real money for fake barns, and they’ll be offended you asked.
FarmVille had more than 80 million monthly active players at its peak. A lot of them were clicking on virtual cows three hours a day. Plenty of them were paying real money for fake barns.
If a user survey had been your research method, you would have missed the entire decade of social gaming. You would have killed the product before it shipped. And you would have had a spreadsheet full of validated data explaining why user surveys lie, while calling it proof that you were right.
The same paradox keeps showing up under new packaging. Ask ten people in 2022 whether they would solve a five-letter word puzzle once a day, every day, and share their score with their group chat. Most will shrug. Wordle went from a few dozen daily solvers to millions in a matter of months. Ask ten people whether they would log into a video game every single day, forever, or lose currency they need to summon characters they may never get. Most will call it predatory. Genshin Impact has done that with tens of millions of players for years. The names change. Layer 1 keeps disagreeing with Layer 4 in exactly the same way it did in 2009.
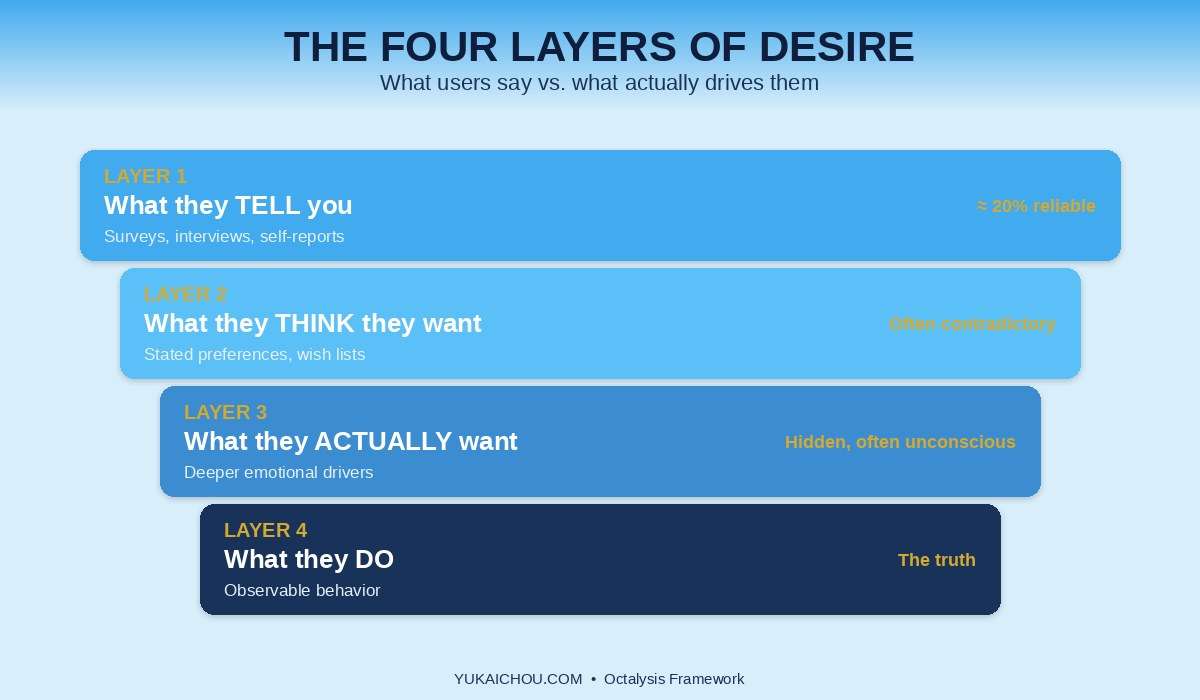
This is the problem I call the Four Layers of Desire. Most companies do user research at Layer 1 (what people tell you they want) and build businesses on it. Layer 1 is roughly 20% accurate. The other 80% of human desire lives in three layers underneath, and those layers are where products actually succeed or fail.
Speed Run Notes
- Layer 1, what users tell you, captures about 20% of the truth. The other 80% lives deeper, and surveys cannot reach it.
- Layer 4, what people actually spend their time doing, is the only reliable signal. FarmVille’s 80 million players proved it against every survey in the room.
- Question order corrupts data. Ask “how happy are you?” before “how many dates last month?” and you get zero correlation; flip the order and you get near-perfect correlation.
- Don’t ask. Simulate. Paper prototypes, fake landing pages, and AdWords split tests reveal Layer 4 behavior at a fraction of the cost of a survey instrument.
- The follow-up question is where Layer 3 surfaces. “What’s your favorite game?” stops at Layer 1; the fourth why-question unlocks the real motivation.
In This Article
Author Credibility: Yu-kai Chou

Yu-kai Chou created the Octalysis Framework after studying gamification since 2003 — years before the term entered mainstream vocabulary. As a Human-Systems Architect & Behavioral Designer, his framework has been applied by LEGO, Microsoft, Porsche, Coca-Cola, Salesforce, and MrBeast, impacting over 1.5 Billion Users.
Chou has taught the Octalysis methodology at Harvard, Stanford, Yale, Tesla, Google, BCG, and IDEO.
His work has been cited by Harvard, Stanford, MIT, Forbes, Wall Street Journal, Wired, US Department of Energy, NIST, NSF, NCBI, US Department of Education, ClinicalTrials.gov, and Google Scholar — with 3,700+ more academic publications. Explore his books here.

The Four Layers of Desire
Most founders, product managers, and researchers treat “what users want” as a single thing you can capture with the right questions. It isn’t. Human desire splits into four distinct layers, and they disagree with each other constantly.
Understanding the disagreement is the whole job.
Layer 1: What They Tell You They Want
This is the top layer. It’s what a user writes on a survey, says in an interview, or checks in a focus-group questionnaire.
It gets filtered by two things before it reaches you: social stigma and self-image. People say what sounds good, because saying something makes them feel like the person who says it. “Do you think the environment is important?” Almost everyone says yes. Saying yes is free. It costs nothing and it signals virtue.
“Would you spend money on virtual cows?” Almost everyone says no, often with something close to offense. “Who do you think I am? I’m not that stupid.”
The problem is that Layer 1 correlates weakly with behavior. Weak enough that in my research work, I assume Layer 1 captures about 20% of what’s actually going on.
Layer 2: What They Think They Want
Layer 2 is more sincere. These aren’t posed answers. They’re the genuine beliefs people hold about themselves.
The gap is that those beliefs still don’t match behavior.
A person writes out a checklist for their ideal partner. They mean it. They also, reliably, end up dating people who match none of the checklist. A person sincerely believes they care about eco-friendliness. They also never factor it into a purchase decision.
Layer 2 is where self-deception lives. Not intentional lies. Not performance for an audience. Just a map of yourself that doesn’t quite line up with the territory. Everyone has one.
Layer 3: What They Actually Want
Layer 3 is the real motivation. The one that actually drives behavior. And it often contradicts everything above it.
You can’t survey your way into Layer 3. You have to probe. Deeply. With enough patience to let the surface answers fall away.
For product designers, this is where the gold lives. A person who says they want “a learning app for my kids” (Layer 1) may actually want “something my kids will beg to use so I can stop feeling like a bad parent for handing them YouTube” (Layer 3). Those are completely different products.
Layer 4: What They Spend All Their Time Doing
Layer 4 is the bottom of the stack. It’s the revealed preference. The thing people actually do with their time, attention, and money.
Layer 4 sometimes contradicts even Layer 3. A person who wants freedom (Layer 3) spends 50 hours a week in a job they hate because loss aversion keeps them there. A person who wants to be healthy (Layer 3) orders DoorDash four nights in a row.
Layer 4 is the ground truth. It’s also the hardest to fake. The problem is that most user research methods don’t touch Layer 4 at all.
Why Layer 1 Is Only 20% of the Truth
The classic founder trap is ten years old and still killing products this week.
You build something. You describe it to a friend. “Would you pay $20 for this?” Your friend says yes. You feel validated. You ship it.
Then the friend says, six months later: “Well, I said I would. Doesn’t mean I’m going to.”
Every working designer has lived this moment. It’s Layer 1 colliding with Layer 4. The gap isn’t a friend being flaky. The gap is that “would you pay” and “do you pay” live in different neural systems, and only one of them has your credit card in it.
Surveys, interviews, and focus groups at their best capture about 20% of the truth. The other 80% lives in Layers 3 and 4, which require entirely different extraction methods.
This is why the single most dangerous phrase in product development is “we have data.” If the data lives at Layer 1, it’s seductive precisely because it’s clean. Everyone in the room nods. The slides look great. The product ships. And then Layer 4 sends its invoice.
The Layer-Mismatch Diagnosis
Here’s the move that separates good product thinkers from the ones who get blindsided. Never trust a single layer. Triangulate.
If your survey says 95% of people care about the environment, but sales data from every sustainability product shows only 15% of the market actually buys eco-friendly when the price is higher, you don’t have a mystery. You have a layer mismatch. The 95% is real and so is the 15%. Both describe the same population. They just describe different layers of it. The job is not to pick which number is “right.” It is to know which layer you are reading and design accordingly.
A practical heuristic: whenever you see a survey number that seems too good to be true, look for the corresponding behavioral number. If no one on your team has bothered to collect it, assume the survey number is aspirational until proven otherwise. The strongest founders I work with run this check before they let a single Layer 1 chart into a strategy deck.
The FarmVille Paradox
The clearest illustration I know of the Four Layers is FarmVille. The game had more than 80 million monthly active players at its peak. A lot of them spent three to four hours a day on it. A non-trivial fraction paid real money for virtual buildings they would never physically own and could not use.
Now imagine running a focus group in 2008 to validate the concept.
“Would you play a game where you spend three to four hours every day clicking on virtual cows and plants, and spend real money buying buildings that don’t exist?”
I’ve watched this question be asked. The response is almost angry. “Who do you think I am? I’m not that stupid.” People feel offended at the framing. They rate the concept zero out of ten. They predict, honestly, that they would never touch such a product.
And then they go home and play three hours of FarmVille.
Robert Kurzban, in Why Everyone (Else) Is a Hypocrite, puts it this way: everyone holds a moral and behavioral standard in their own head, and most people don’t live up to it. They don’t even know they don’t. They only notice when other people fail to. The structural reason that gap is invisible from inside the respondent’s own head is that admitting it would mean losing a piece of identity (CD4), and the brain quietly edits the evidence rather than pay that loss.
The FarmVille survey responder is not lying. They have a Layer 1 self-image of a person with better things to do than click on virtual cows. They also have a Layer 4 behavior pattern where, at 9:37 PM after a long day, clicking on virtual cows is the most regulating thing they can do with their brain.
Both are real. Only one drives behavior.
The structural reason these two never line up is cost asymmetry. Layer 1, saying you would never play, is free. No money changes hands. No time is committed. Core Drive 8 (CD8): Loss & Avoidance doesn’t activate, because there is nothing to lose by saying it. Layer 4, actually playing, costs three hours of your evening, the dopamine you spent, and sometimes real money on a virtual barn. CD8 activates the moment behavior is on the line. The survey doesn’t pay the CD8 tax. Real decisions do. That tax gap is the entire reason intent-to-behavior conversion is so reliably weak.
This is why I never trust a product decision made purely on survey data. The survey is measuring the self-image. The self-image is not the customer.
How to Extract Layer 4 Without Asking
If Layer 1 is 20% of the truth, the next question is obvious. How do you reach the other 80%?
Four methods, in order of reliability.
Method 1: Simulate the Environment
The best way to validate any product hypothesis is to stop asking and start watching.
Paper prototyping. Draw the screens on paper. Put the paper in front of a user. “What would you click?” Swap the paper for the next screen. “Now where?” This reveals real navigation instincts for nearly zero cost. It’s also the step most teams skip because it feels unscientific. It isn’t. It’s Layer 4 behavior on Layer-1 infrastructure.
Fake landing pages. Build a website pretending the product already exists. “$50, click here to buy.” Clicking reveals: “Still in beta, join our email list.” If nobody clicks buy when the product appears to exist, ten months of building won’t fix that. Tools like Carrd, Framer, and Webflow have collapsed this from a weekend project to an afternoon, which means the only excuse for skipping it now is wanting to stay inside Layer 1.
Search-ad split tests. Tim Ferriss used this method in 2007 to validate The 4-Hour Work Week. He bought Google AdWords (now called Google Ads) for multiple possible titles and measured click-throughs. “Selling Drugs for Fun and Profit” lost. “The 4-Hour Work Week” won. That’s how the famous title got picked. The same play runs today on Google Ads, Meta, TikTok, or Reddit. The platform name changes; the Layer-4 signal does not.
Physical environment tests. Ferriss also printed his candidate book covers, placed them on top of other people’s books in bookstores, and sat watching how passersby reacted. Ethically questionable. Cleanly Layer 4.
The principle running through all of these is the same. Don’t ask the question. Build the smallest possible version of the environment and see what behavior it triggers.
Method 2: Deep Qualitative Probing
Surveys give you Layer 1. Interviews, done lazily, also give you Layer 1. Interviews done deeply are where Layer 3 surfaces.
Here’s a sequence I used for a Microsoft Edge project designing learning tools for middle and high school students:
- “What’s your favorite game?” → “Fortnite.”
- “Why do you like Fortnite?” → “I get to kill people.”
- (A checkbox survey stops here. Useless insight.)
- “Do you prefer killing weak opponents easily, or strong opponents with difficulty?” → “Strong ones. But I still beat them more than they beat me.”
- Now I can diagnose Core Drive 2 (CD2): Development & Accomplishment, Core Drive 6 (CD6): Scarcity & Impatience under the competitive frame, and Core Drive 8 (CD8): Loss & Avoidance.
- “Is the uncertainty at the start of each match engaging?” → “Yes, always on the edge of my seat.”
- Core Drive 7 (CD7): Unpredictability & Curiosity lights up.
Seven exchanges. A survey would have produced one data point: “likes Fortnite.” Seven exchanges produced a Core Drive profile I can actually design against.
The follow-up question is where the money is. The first answer is the headline. The fourth why-question is where the human is.
A rule I keep for my team: companies that only look at surface data and copy what works can never change anything. They don’t know why it works. One day someone tweaks a “harmless” element, engagement collapses, and nobody can explain it. Layer 4 without Layer 3 is fragile.
Method 3: Strategic Survey Design
Sometimes you have to use a survey. Legal requirements, scale, distribution. Fine. Here’s how to make survey data less broken.
Consistency checks. Ask the same question in different forms. Respondents who contradict themselves inside a single survey are giving you random noise. The trade-off is length; longer surveys mean more dropout. Usually worth it.
Pre-qualify the terms. “How sustainable do you live?” is a broken question. Deep sustainability experts rate themselves harshly because they know how much more they could do. Casual people rate themselves a 5 because they don’t throw trash on the ground. Define the terms before asking, or use behavioral indicators instead of self-assessment.
Treat the survey itself as a designed experience. The survey is a desired action. What Core Drive motivates its completion? For a small friend list, Core Drive 5 (CD5): Social Influence & Relatedness carries it. For a cold-list distribution, bake humor, personality, and quick feedback loops into the language. A boring survey is a biased survey. Only masochists finish it.
Use surveys for more than one purpose. A good survey simultaneously: (1) produces real insight for you, (2) gives you a number you can quote to investors, (3) motivates the respondent by the act of being asked, and (4) validates a product direction. Best-practice framing: “95% say the environment is important, but only 15% live sustainably. We’re bridging that gap.” Acknowledging the Layer 1 / Layer 4 gap becomes your value proposition.
Design the sequence, not just the questions. The real craft of survey design isn’t asking better questions. It’s designing sequences where each question sets up the next one to hit harder. A “free yes” question, like “do you think being healthy is important?”, is worthless on its own. Pair it with the expensive follow-up, like “how many of your last ten meals were what you would call healthy?”, and the gap itself becomes the data. The respondent now feels the layer mismatch in their own body. That feeling is more useful than the original answer ever was.
Decision Mapping: Which Layer for Which Decision
Each layer is useful for something. The mistake is using the wrong layer for the wrong decision.
- Layer 1: useful for marketing copy, PR, and political messaging. If the goal is what someone will publicly defend, what they will put on a bumper sticker, what their tribe will applaud, Layer 1 is your reliable signal. Performance has real consequences, and Layer 1 is the performance layer.
- Layer 2: useful for selling identity, status, and self-improvement. Aspirational self-image is the buying engine for the entire personal-development category. Sell the version of themselves the buyer wants to be. Just don’t expect them to follow through on Layer 4 unless your product makes the follow-through painless.
- Layer 3: useful for product positioning and message-market fit. The “what they actually want” layer is where the genuine emotional payoff lives. A product that names the Layer-3 desire correctly converts at multiples of one that names the Layer-1 desire.
- Layer 4: required for revenue. If the goal is money changing hands, repeatedly over time, only Layer 4 evidence counts. A product roadmap built on Layer 1 data is a fantasy roadmap. A product roadmap with Layer 4 evidence behind every bet is one I’ll defend in a board meeting.
The failure mode is treating “data is data,” which means pulling a Layer 1 number into a revenue decision because it was the data that happened to be available. The survey doesn’t pay the CD8 tax. Don’t let it pretend it does.
Method 4: Vision Over Data
Sometimes the right move is to go against Layer 4.
Supernatural, the sustainable cleaning-products company, surveyed its customers. “No toxicity for children and pets” ranked highest. Eco-friendliness ranked lowest. The execution team proposed emphasizing toxicity in all marketing. Cleanest data-driven decision you’ll ever see.
The founder, who sits on published lists of the wealthiest self-made women in the United States, overruled them. “The fact that people think eco-friendliness is low priority means we need to change that. We need to educate them. The last thing I want is another billion-dollar company that doesn’t help the environment.”
That decision built a unicorn.
My read: going with what people say they care about maximizes success probability. Going against it with a vision is strong leadership. Both are valid. The failure mode is making either choice unconsciously. Naive acceptance of Layer 1 data is a career-ending move disguised as rigor.
The Dating Happiness Study (Why Question Order Is a Design Decision)
Before moving on, one final warning about survey design, because this is the one that embarrasses most teams.
A classic psychology study asked two groups the same two questions in different order:
- Group A: “How happy are you?” followed by “How many dates did you go on last month?” Result: near-zero correlation between dating and happiness.
- Group B: “How many dates last month?” followed by “How happy are you?” Result: near-perfect correlation.
Same questions. Same population. Opposite conclusion.
The first question primes the emotional frame for every answer that follows. If I ask about dating first, your happiness answer becomes “my happiness relative to my dating life.” If I ask about happiness first, dating becomes one input among many.
Question order isn’t a logistics choice. It’s a design decision that actively shapes the responses. Most teams never audit it. And so most data coming out of in-house survey platforms is not measuring what the team thinks it’s measuring.

The Octalysis Lens on the Four Layers
If you’ve worked with Octalysis, you already know where this is going. Octalysis is a framework for diagnosing the motivations that drive behavior. Those motivations don’t live on the surface. They live at Layers 3 and 4.
A survey that asks “do you find this product engaging?” gets a Layer 1 answer. A Core Drive analysis of the actual behavior, which features people repeatedly return to, which variable rewards they chase, how long they stay, gets a Layer 4 answer.
What’s worth naming, because almost no one names it: each layer is dominated by a different Core Drive. Once you see which Core Drive is doing the talking on each layer, you can predict in advance which layer your data is actually measuring.
- Core Drive 1 (CD1): Epic Meaning & Calling sits on Layer 1. “Yes, the environment matters.” Saying it costs nothing and signals virtue. Real CD1 only shows up in Layer 4, where someone donates monthly, changes diets, or accepts inconvenience for the cause.
- Core Drive 2 (CD2): Development & Accomplishment sits on Layer 2. “I want to learn Spanish, get fit, read more.” Sincere aspiration. Belief is real; behavior follows only when the product engineers a daily Layer-4 feedback loop. Duolingo’s win is exactly this. They don’t sell the Layer-2 desire to be bilingual, they engineer the Layer-4 streak that gets you there.
- Core Drive 4 (CD4): Ownership & Possession is the hypocrisy engine across all four layers. People own their self-image strongly. Admitting their behavior doesn’t match it would mean losing a piece of identity. So they report the identity in Layer 1 and hide the behavior, even from themselves, in Layer 4.
- Core Drive 5 (CD5): Social Influence & Relatedness shapes Layer 1 almost entirely. Even on an anonymous form, the respondent imagines a peer group reading the answers. This is why anonymous and public surveys on the same question yield different numbers. The audience the respondent is performing to is real, even when the form swears it isn’t.
- Core Drive 8 (CD8): Loss & Avoidance is why Layer 1 and Layer 4 diverge in the first place. Stating a preference is free. CD8 doesn’t activate. Actually buying, switching, or changing behavior triggers CD8 hard, losing money, losing convenience, losing the status quo. The survey doesn’t pay the CD8 tax. Real decisions do. That cost asymmetry is the entire reason intent-to-behavior conversion is so low.
Once you can see Octalysis stacked against the four layers like that, the diagnosis writes itself. If your data lives in CD1 territory, it tells you what’s socially acceptable to claim. If it lives in CD8 territory, it tells you what people will actually pay for. The two answers are almost never the same person, which is the entire point.
This is why I’ve never met a great product designer who leads with surveys. They lead with behavior. Surveys are the decoration around the decision, not the decision itself.
The Octalysis workflow I teach looks like this:
- Observe the behavior (Layer 4).
- Diagnose the Core Drives making it happen (Layer 3).
- Use the diagnosis to design the next iteration.
- Use surveys, only as strategic instruments as described above, to validate or complement.
Layer 1 can come along for the ride. It does not steer.
Frequently Asked Questions
Why do user surveys lie?
Surveys lie because they capture Layer 1, what users say they want, which is filtered by social stigma, self-image, and the desire to sound reasonable. Layer 1 correlates weakly with behavior. The other 80% of truth lives in Layers 2, 3, and 4, which surveys cannot reach.
What is Layer 4 in user research?
Layer 4 is revealed preference: what users actually do with their time, attention, and money. It’s the ground truth of desire. Layer 4 analysis includes behavioral observation, engagement data, purchase patterns, and time-on-task metrics, not self-reports.
Can I trust any survey data at all?
Yes, but only with design. Use consistency checks. Pre-qualify terms. Design the survey itself as a motivational experience. Never let a Layer 1 answer outvote observed Layer 4 behavior. Treat surveys as a secondary instrument, not the primary one.
How does the Four Layers framework relate to Octalysis?
Octalysis is the diagnostic lens for Layers 3 and 4. The Core Drives explain why people behave the way they do, which is exactly the motivation that Layer 1 cannot see. The Four Layers and Octalysis are complements: the Four Layers tells you which data to trust, Octalysis tells you what it means.
What’s the fastest way to test a product idea without building it?
Paper prototypes first. Fake landing pages second. Google Ads (or Meta, or TikTok) split tests on different product names third. These three methods will give you Layer 4 signal in a week for under $500, which is cheaper than the first sprint of building the real thing.
The Bottom Line
If there’s one thing I want a reader to take from this post: stop asking users what they want. Start building cheap simulations of the environment where they would want it, and watch what happens.
The product that sounds stupid when described in a survey, like “click on virtual cows for three hours a day,” may have enormous real-world demand. The product that sounds brilliant, like “of course I’d pay for that,” may have zero actual buyers. The only method that separates the two is behavioral observation at Layer 4.
If you want to go deeper on how to diagnose the motivations that drive Layer 4, the Octalysis Framework is the next step. If you want to see it applied across 70+ engagement techniques with case studies, Actionable Gamification walks through every one of them. And if you want to train yourself to see through Layer 1 in any domain, from product to management to parenting to your own decisions, the Four Layers is the lens I’d put in your hands first.
One last thing, because it is the line I keep coming back to in coaching. The four layers aren’t four populations. They’re four versions of the same person. And the version you target determines whether you ship a product or a fantasy.
The next move if your team is still trusting Layer 1 data
If you have a roadmap built on survey data and a creeping suspicion that the numbers aren’t predicting behavior, that suspicion is the most useful instrument in the room. The fastest way to know whether your data is Layer 1 or Layer 4 is to put it in front of someone who has run the diagnostic on companies whose products reach billions of users. Book a gamification consulting conversation with Yu-kai, bring the data your team is making decisions on, and we will walk through which layer it actually lives at, and what the next bet should be once you know.
Related Reading
- The Octalysis Framework for Gamification & Behavioral Design
- Why Users Love Your App and Never Come Back (the retention side of the same coin)
- Onboarding Design: The First 5 Minutes That Matter
- The Plausibility Detector: How to Raise Critical Thinkers
- The Octalysis Brainstorming Engine